Calling A New Short-Term Downtrend
Image Source: Unsplash
The Short-Term Trend
The market sold off on Friday, but it barely did any technical damage to the chart of the SPX, as shown below. There is a trend line break, kind of, but the close was still above a short-term support level. The new 52-week lows were slightly elevated, but certainly not enough to be alarmed by at this point.
Despite only experiencing a few gentle cracks in the uptrend, as shown in the chart above, I'm ready to call this a new short-term downtrend, a long-overdue one. I can't remember the last time the PMO remained at the top of its range for this many days.
If the news from the Middle East improves over the weekend, there could easily be a bounce higher for stocks on Monday, but I can't see myself as a buyer. I'm not buying stocks aggressively again until this PMO index reaches all the way down to the bottom of its range.
This next chart shows the major indexes closing below their 5-day averages, which is the first thing needed before declaring a new short-term downtrend. Again, Friday's action doesn't look very bad despite closing below the 5-day average.
The number of stocks above the 50-day averages dipped below the 5-day average, and this chart has a more serious look that confirms a new short-term downtrend.
The bullish percent for both major exchanges also dipped, but not by enough to really take notice.
There is nothing in this chart of the junk bond ETF to suggest that the market is concerned about the Middle East at the moment. This is a positive for stocks, but I would watch this chart next week to see if these bonds are sold aggressively. This chart will help show how seriously investors are taking the latest Middle East conflict.
The Summations ticked lower on Friday, but not by enough for us to worry about. Again, watch these indicators next week.
Bottom Line
Every short-term uptrend is followed by a short-term downtrend. As obvious as it sounds, it still needs to be repeated because it is so easy to forget, particularly when you think everyone but you is making money. I don't know what other people are going to do, but I'm going to wait to buy when the PMO index is near the lows of its range. When the PMO is at its lows, that is when the lower-risk short-term opportunities to buy present themselves.
On Friday, I bought back partial positions in the gold miner stocks that I sold the previous week. More about gold in a bit.
The Longer-Term Trend
Mark Minervini was a guest on Investors.com a while back, and he said that he has not participated in this rally much because there are so few stocks for him to choose from. This is because his first filter when assessing stocks is to reject any that are trading below their 200-day average.
The chart below confirms what he is saying and that there really is a remarkably small number of stocks trading above the 200-day. I don't like this. A healthy market should have a healthy number of stocks participating.
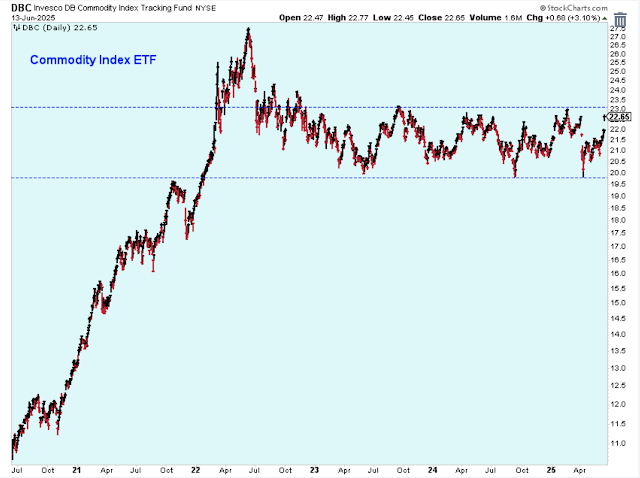
Speaking of what was discussed recently, CNBC guests were frequently mentioning the rally in oil, gold, and other commodities this past week. This ETF is about 60% energy-related, and it certainly has rallied in the short-term, but longer-term it is well within a range. I don't think I will be too worried until this ETF breaks out above the multi-year resistance.
Here is my favorite medium-term market indicator. I was a bit suspicious when this indicator turned positive a few months ago, and I am poorer for it. I'll be following this chart more closely and with more faith in the future. If it goes negative again, I'm a seller.
Opportunities
Wow, this gold miner ETF is near a new all-time high. This is looking bullish.
This is a chart of the actual metal. It was a truly phenomenal breakout early last year. Now, it is quite overbought. What to do when the associated stocks are just now breaking out while the metal looks so extended? I'm not sure, except to say that I prefer the miners to the metal, and that I'm ready to sell the miners if I think that there is a gold correction brewing.
The longer-term chart above is scarily extended, but the short-term daily chart below of gold looks really good. This is a bullish indicator.
The miners in the short-term are looking good, too.
Outlook Summary
- The short-term trend is down for stock prices as of June 13
- The medium-term trend is neutral for Treasury bond prices
More By This Author:
The Market Pushes HigherWill The Market Push Higher Or Plummet From Here?
From Market Crash To Market Optimism
Disclaimer: I am not a registered investment advisor. I am a private investor and blogger. The comments below reflect my view of the market and indicate what I am doing with my own accounts. The ...
more


