
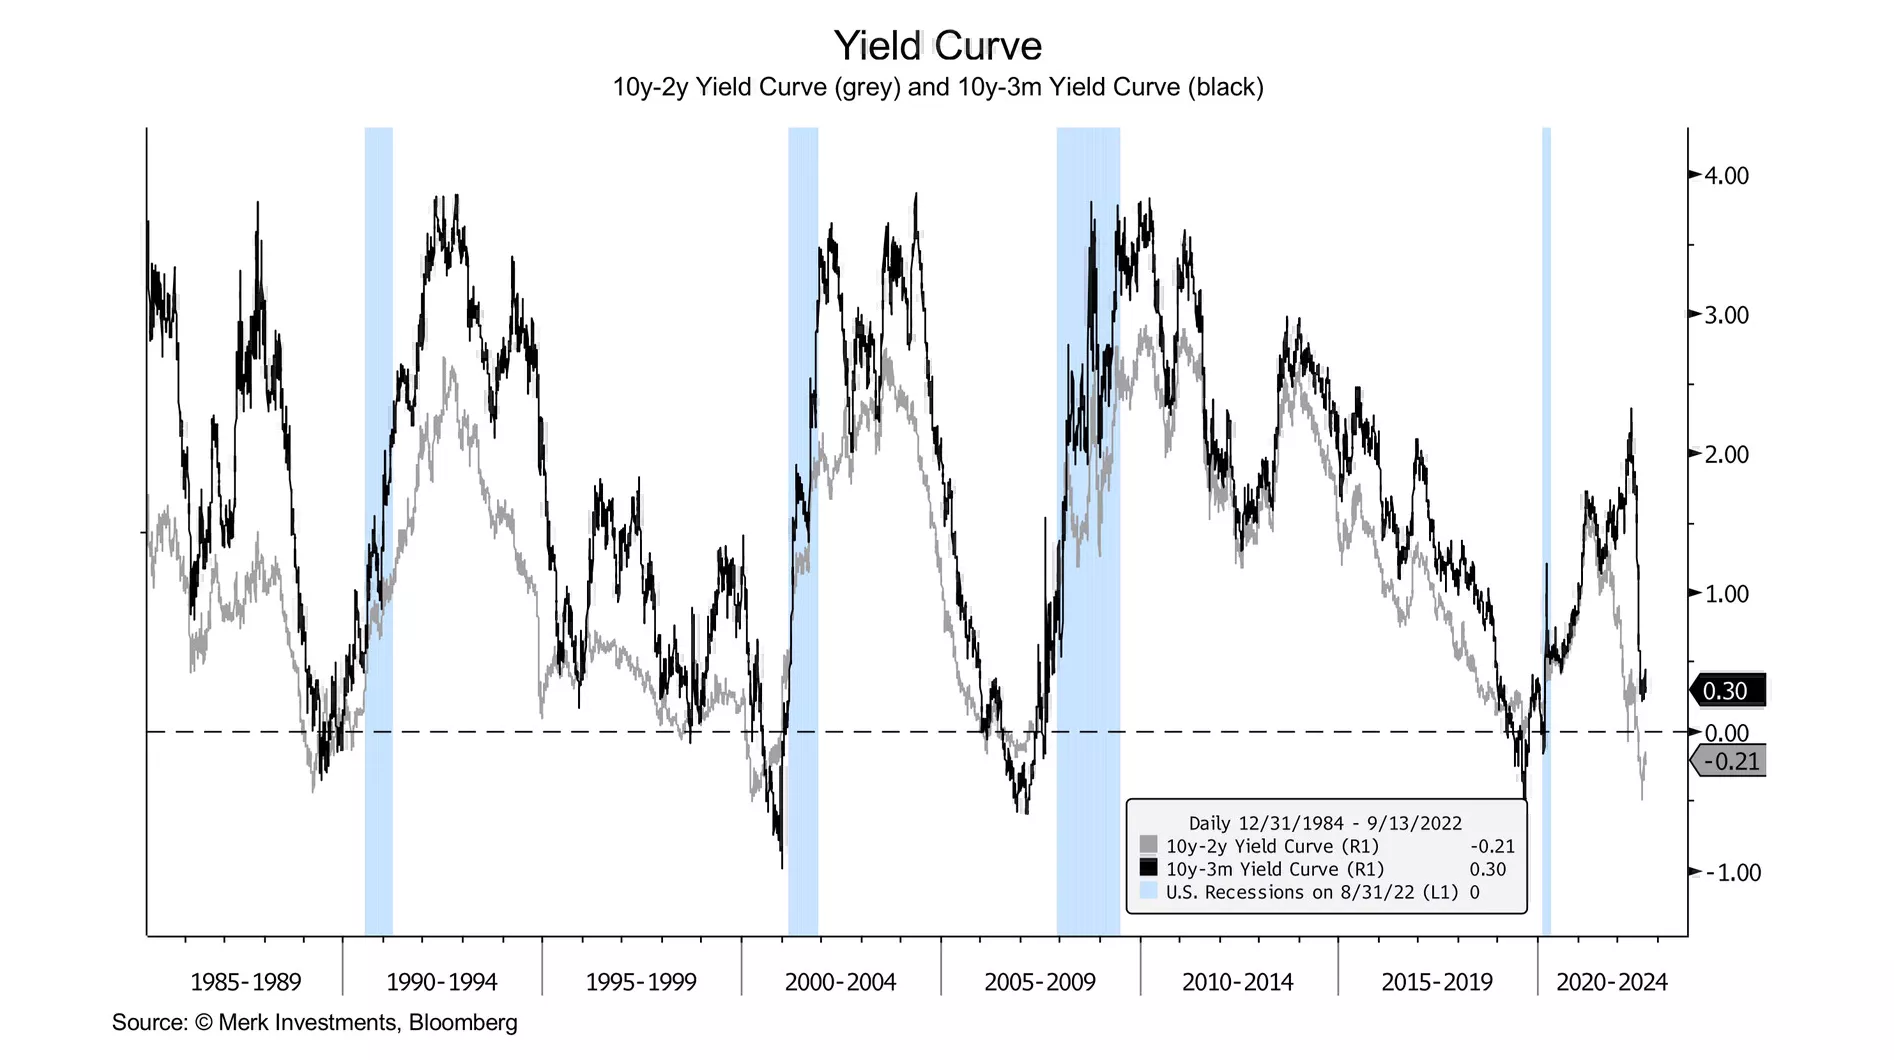
The recession still does not look imminent. Initial jobless claims are trending back down and the 10yr3m yield curve still has not inverted. But longer leading indicators continue to suggest recession risk is elevated over the next year. Nevertheless, a soft landing remains possible.
The August jobs report was the best in recent memory. The unemployment rate went up for good reason, which was a jump higher in the labor force participation rate. The increase in participation from prime-age women specifically might suggest that some of the Covid- related impediments to returning to work are easing. Importantly, jobs were added any way you look at the data: household survey, establishment survey, etc. Whatever probability you were assigned to a soft landing before the report, should be higher after that report. Also, you typically don't get a recession until at least one cyclical jobs category goes negative year over year. Currently, none of them are—across mining, manufacturing, and construction. Also, you typically don't get a recession until temporary jobs start to decline.
Services PMI readings showed a notable divergence between the ISM report and the S&P Global/IHS Markit report. ISM was better than expected, higher than prior, and well above 50 (the dividing line between expansion and contraction). The S&P Global/IHS Markit report was worse than expected, lower than prior, and well below 50. At the very least, that suggests caution with reading too much good news into the ISM report. The divergence is in part driven by the size, composition, and weighting of the survey results, with the S&P Global/IHS Markit report often proving to be a leading indicator for the ISM report.
Powell’s recent communication and framework suggest that the Fed is committed to being late in easing policy, which suggests that short-end real interest rates are likely to continue to rise for the time being—as the market focuses on leading indicators of inflation (in large part driven by growth/recession concerns) and the Fed focuses on lagging indicators. The current Fed framework increases the chances of a recession in 2023.
House price momentum looks like it is finally starting to crack, which suggests rent inflation should slow materially over the next year. 30yr mortgage rates are making new multi-year highs, which should continue to cool home price appreciation.
The outlook remains highly uncertain with risks to economic growth skewed to the downside. As always, the data and frameworks presented inevitably don’t capture all possible risk factors in real-time and the outlook requires constant reassessment.
More By This Author:
Equity Market Chart Book
Business Cycle Chart Book - Thursday, Aug. 11
Equity Market Chart Book - Wednesday, July 27


Comments
Log in or sign up to join the conversation.