
Bitcoin Retests Low And Bounces At Key 78.6% Fibonacci
Bitcoin (BTC/USD) has slowed down in the past 2 weeks. Price action is moving sideways and failing to break below the bottom or above the top.
Based on the Elliott Wave patterns and Fibonacci levels, we do expect a bullish bounce to occur sometime soon. Price has in fact already made such a bounce at the 78.6% Fibonacci level as mentioned in our previous analysis.
Price Charts and Technical Analysis
(Click on image to enlarge)

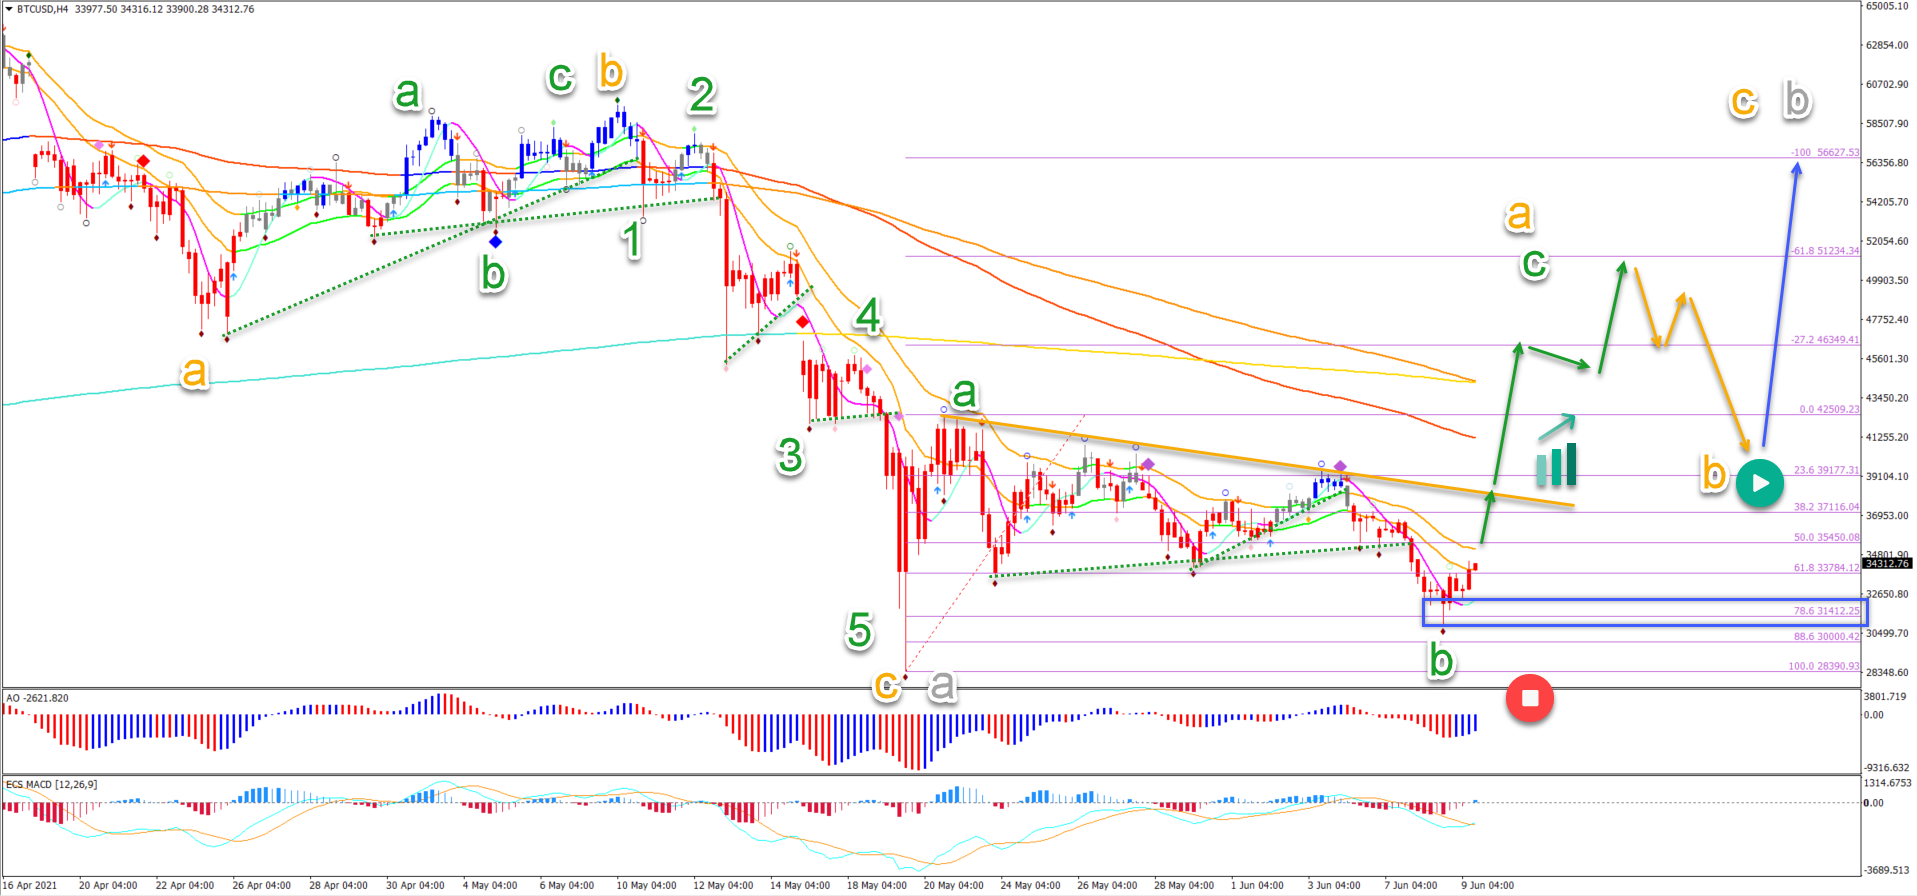
BTC/USD is retesting the 61.8% Fibonacci retracement support level. Yesterday’s daily candle saw a bullish wick emerge after hitting that Fibonacci level again. Here is the context and what we expect next:
- A deep ABC (orange) correction is probably part of a larger ABC (grey) pattern in wave 4 (pink).
- The recent low and bounce at the 61.8% Fib probably indicates the end of the wave A (grey) and start of the wave B (grey).
- The bearish move to test the bottom does not change anything to this outlook. Only a break below the bottom places it on hold (orange circle) whereas a deep retracement invalidates it (red circle).
- A breakout (green arrows) above the resistance zone (red box) and 21 EMAs should confirm a push up to test the previous top.
- Eventually an uptrend (blue arrow) is expected to take price for a higher high and confirm the 345 waves (pink).
On the 4 hour chart, price action is probably building an ABC (green) or 123 pattern:
- The ABC or 123 remains valid as long as price stays above the 100% Fib and bottom.
- A break below the bottom invalidates it (red circle).
- A break above (green arrows) the resistance trend line (orange) and 21 ema zone could indicate a higher low and soon even a higher high.
- The 78.6% Fibonacci retracement level (blue box) is a key support zone.
(Click on image to enlarge)
Disclaimer: CFDs are complex instruments and come with a high risk of losing money rapidly due to leverage. On average around 80% of retail investor accounts loose money when trading with high ...
more

