

Image Source: Pixabay
Bitcoin is still bullish and the rise looks impulsive on the weekly chart, so it's ideally unfolding a five-wave bullish cycle within higher degree wave (V) that can be coming to an end this year, as we see it trading in final wave V of (V). There's room up to interesting Fibonacci cluster target area @ 150K area.
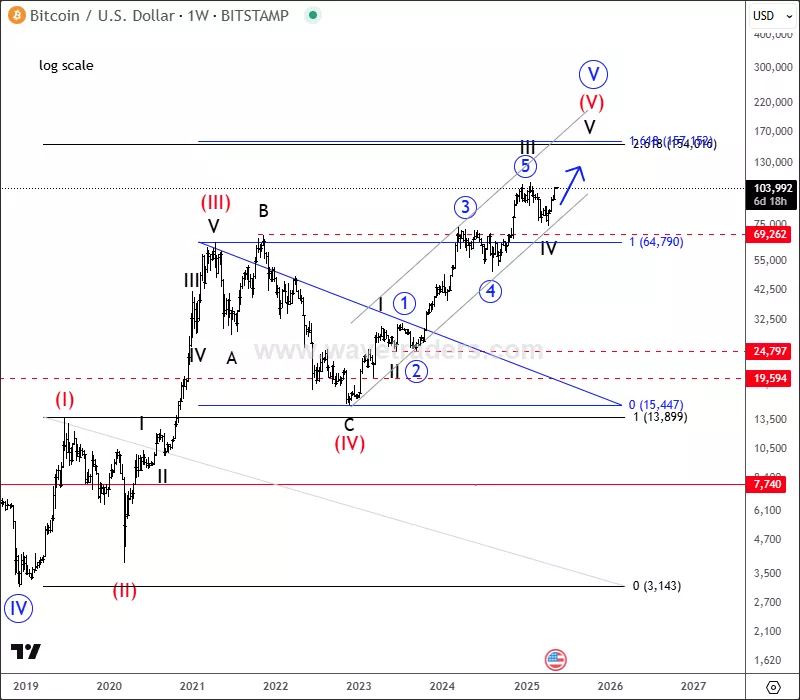
BTCUSD Weekly Chart
Even cyclically, we are in the late stages of a bull run that can end this year, ideally around October 2025.
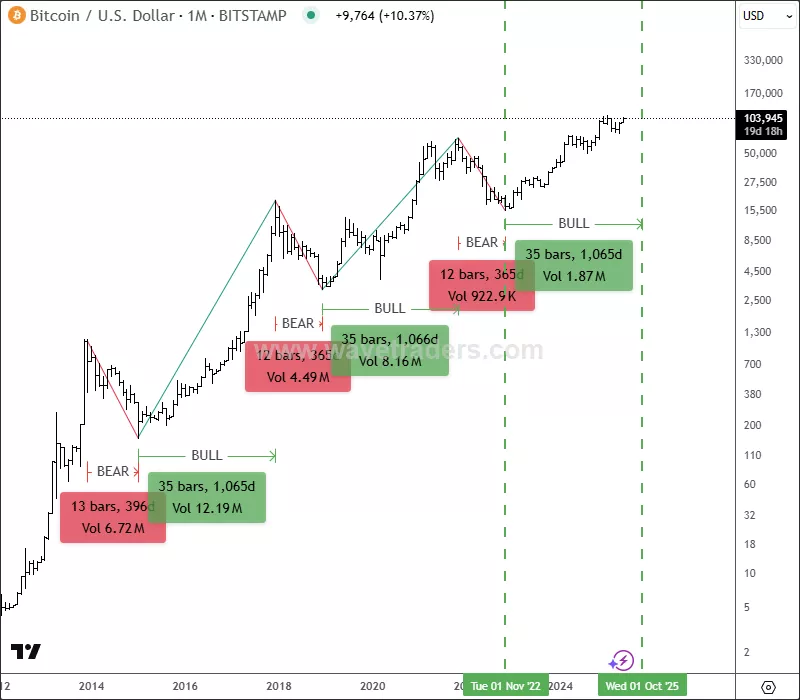
BTCUSD Monthly Cycles
Bitcoin is actually sharply and impulsively recovering after recent ABC correction in wave IV on a daily chart, so wave V can now be underway. In fact, the move up has impulsive characteristics on 4h time frame and we can clearly see five waves up that can send the price even higher after any pullback.
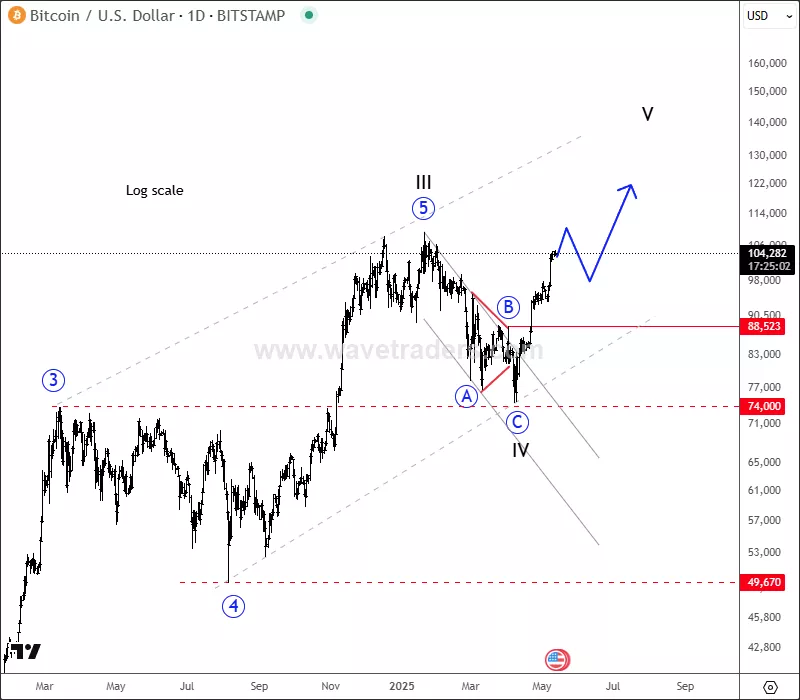
BTCUSD Daily Chart
It can be now actually finishing subwave "v" of an impulse around channel upper line and 105k area, so be aware of a reversal down in minimum three waves. However, now that it's close to 110k all-time highs area, we may also see an extension straight into all-time highs and in such case, it can be alternatively also in subwave "iii" of an ongoing five-wave impulse.
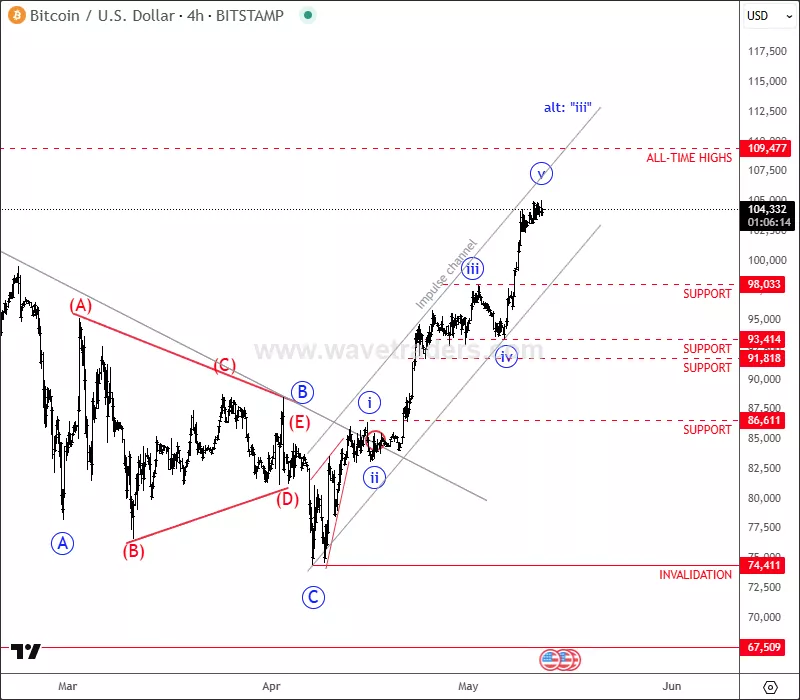
BTCUSD 4H Chart
For a detailed view and more analysis like this, you may want to join our live webinar today on Monday, May 12, 2025 @ 15.00CET: Direct Link.
More By This Author:
US Dollar Is Finishing An Intraday Correction Within Bearish Trend
USD/MXN Mirrors 2017 Reversal; Elliott Wave Pointing Lower
Crude Oil: How We Spotted The Direction Based On Elliott Wave


Comments
Log in or sign up to join the conversation.