
The post Bitcoin Price Struggling at $64,000: Here’s Why it Could be a ‘Do-or-Die’ Weekend for the BTC Price appeared first on Coinpedia Fintech News
After losing the $65,000 support, the Bitcoin price is now utilising all its strength to hold the $64,000 support. The selling pressure over the token has intensified, which has compelled the price to pierce through the lower support. While the weekend trade approaches, a greater possibility of massive price action can be expected. As the bears’ dominance has grown, the BTC price is more likely to form new lows.
Similar to the previous breakdown in the first few days of May, the BTC bulls are trying hard to validate a fakeout, trapping the bears. Both the chart formations and the technicals have been displaying a similar formation, due to which a rebound seems to be more likely. However, the rally continues to fall short of the required buying volume, making the weekend trade uncertain.
On the other hand, the price continues to hold both bullish and bearish possibilities, so it would be interesting to watch which trade will play out well.
(Click on image to enlarge)
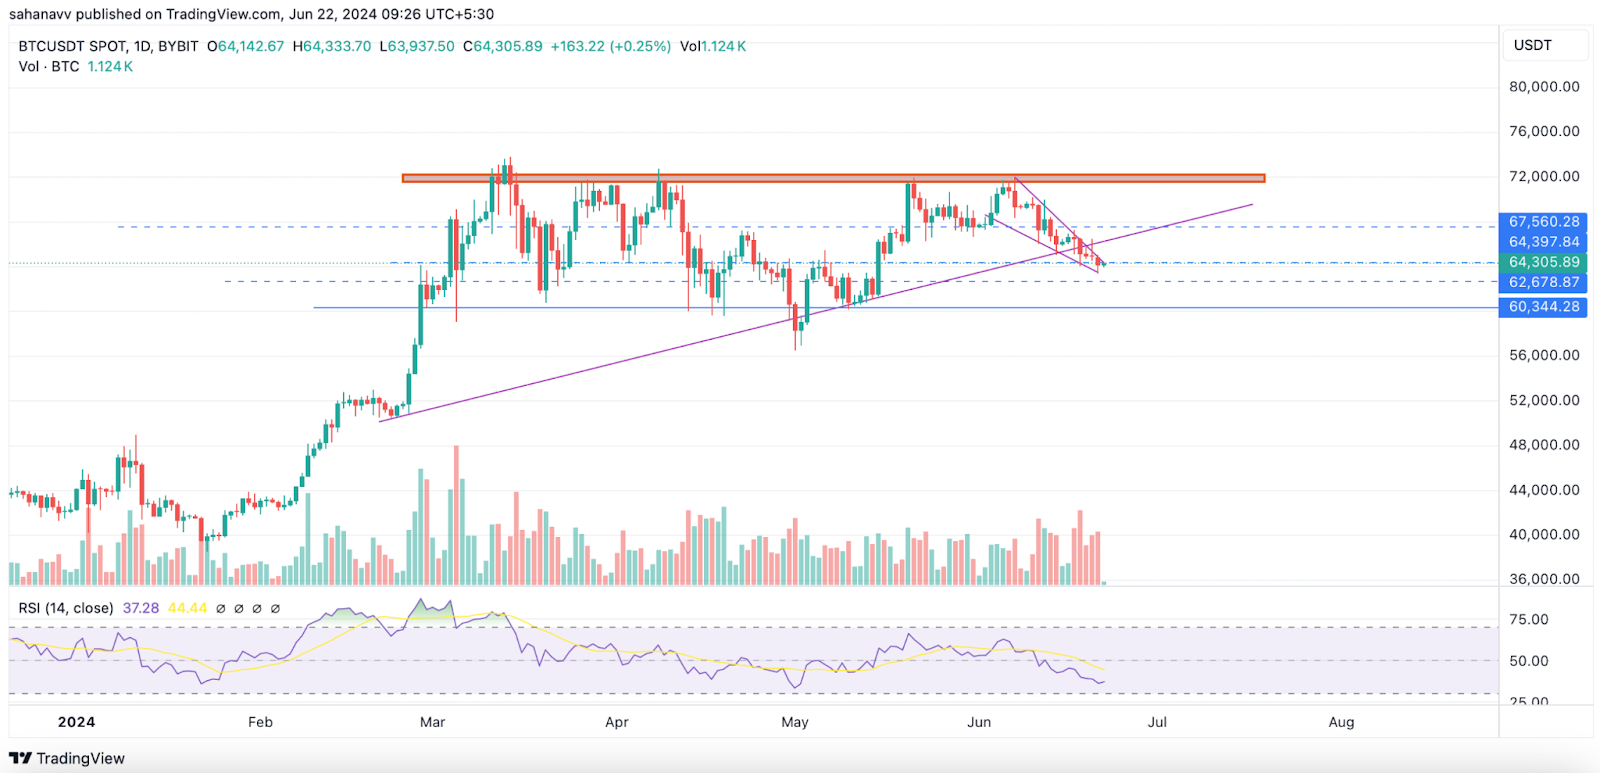
The daily chart of the BTC price suggests the token has lost some of its important levels, which has raised bullish uncertainties. The buying pressure has intensified, due to which the rally is constantly extending within the falling wedge. However, the levels have broken down the ascending triangle and hence more bearish price action could be on the horizon. The plunged RSI, the rising selling pressure within the MACD, the price hitting the lower bands of the Gaussian channel and both the lead spans A & B of the Ichimoku cloud advancing towards a bearish crossover, support the bearish narrative.
Now that the price is advancing towards the last week of the quarter, a major price action is expected, which may flow in either direction. The price is hovering between two trend reversal zones at $67,560 & $62,678.87, which are the interim resistance & support levels. A pass through any of these levels may decide the next course of action, as a failure to hold the lower support may initiate a fresh plunge below $60,000, while a bullish rebound could elevate the levels back to $70,000.
More By This Author:
Ripple Clears Hurdle In Court: XRP Not Ruled As Security, Claims Dismissed
Polkadot Races Ahead: Conor Daly Drives DOT To Indy 500 Spotlight
Shiba Inu Faces Increased Selling Pressure as Network Activity Declines: What’s Next for SHIB’s Price?

Comments
Log in or sign up to join the conversation.