
Bitcoin Price Outlook: BTC/USD Probes Critical Trend Support
Bitcoin has been stumbling lower since BTC/USD notched a fresh record high above the $60,000-price level earlier this month. The popular cryptocurrency stretched another -2% lower today even in spite of Elon Musk tweeting you can now buy a Tesla with Bitcoin. It appears that BTC/USD price action has been under pressure largely in response to broad-based US Dollar strength. Bitcoin selling pressure over recent sessions has steered BTC/USD lower to test critical trend support. This trendline is extended through the major year-to-date swing lows notched on 27 January and 28 February.
BTC/USD PRICE CHART: DAILY TIME FRAME (19 DEC 2020 TO 24 MAR 2021)
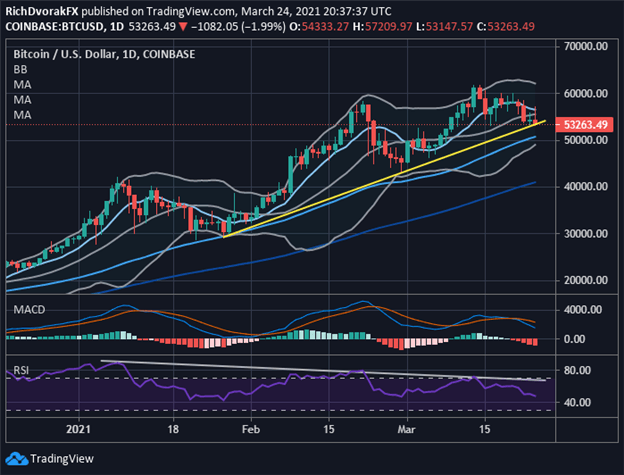
Chart by @RichDvorakFX created using TradingView
A break of this ascending trendline could see another push by Bitcoin bears toward the psychologically-significant $50,000-price level. The positively-sloped 50-day simple moving average, as well as the lower Bollinger Band, reinforce this potential zone of technical support. Catching a bid off this technical support level could bring all-time highs back into focus. A softer US Dollar, coupled with stimulus checks trickling their way into the financial system, might help this bullish scenario materialize.
A negative divergence on the relative strength index is notable, however. So too is the short-term bearish trend underpinned by its 8-day simple moving average and recent string of lower highs. Failure to reclaim this nearside technical obstacle could coincide with more weakness for BTC/USD price action. To that end, invalidating the support level near $50,000 might see BTC/USD price action slide toward its 100-day simple moving average before bulls take a stand.
Disclosure: See the full disclosure for DailyFX here.


