

Image Source: Unsplash
After peaking at over $123,000 in mid-July, Bitcoin (BTC) has entered a phase of market indecision. As of now, the price hovers just above $115,000, marking a 3% decline over the past seven days. Analysts point to a breakdown below the $116,000 support zone on July 31, pushing Bitcoin into a low-liquidity “air gap” between $110,000 and $116,000.
Short-Term Holders Face Reduced Profitability
Data from Glassnode shows that opportunistic buyers accumulated around 120,000 BTC during a bounce between $112,000 and $114,000. However, analysts warn that this short-term activity is insufficient to create a strong support base.
~120k $BTC were acquired during the rebound from $112k to $114k - evidence of opportunistic buying. Yet supply within the $110k–$116k range remains sparse, meaning stronger accumulation is needed to form lasting support: https://t.co/1J8WjAFubu pic.twitter.com/vL4OL3hOlg
— glassnode (@glassnode) August 7, 2025
Short-term holders, who bought Bitcoin within the last 155 days, are now experiencing shrinking profits. Their profitability has decreased from 100% to just 70%, signaling potential weakness in market confidence.
The current cost basis for short-term holders is around $106,000. Although this figure is still below the market price, it is nearing the current price level. If Bitcoin fails to break above the $116,000 level again, this could put pressure on holders.
Bitcoin Faces Sell-Off Pressure Amid Profit-Taking
Bitcoin whales have recently taken profits, with large wallets booking over $44.5 million in profits over the last 48 hours. This activity suggests that a wave of sell-side pressure is affecting the market. Despite this, the overall sentiment remains cautious but optimistic, as the Crypto Fear & Greed Index shows Bitcoin sitting in the “Greed” zone.
Long-term Bitcoin $BTC holders booked roughly $44.5 million in profits in the last 48 hours! pic.twitter.com/KN4tu7znVT
— Ali (@ali_charts) August 7, 2025
On the 4-hour BTC chart, the Bollinger Bands indicate tightening volatility, suggesting that Bitcoin is preparing for a breakout. A move above the upper band near $115,750 could trigger resistance at $118,000. However, if the price gets rejected, there could be renewed downward pressure with support at $112,000.
(Click on image to enlarge)
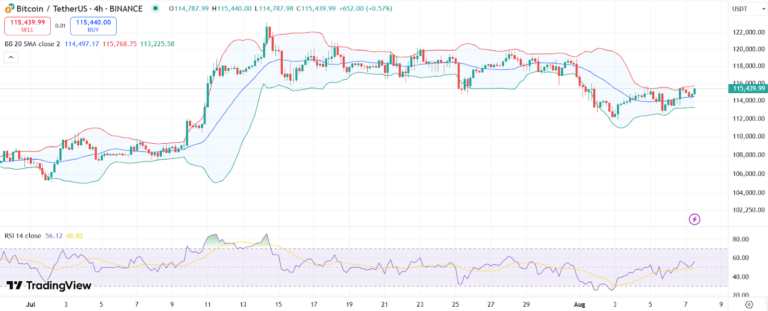
Source: Trading View
The Relative Strength Index (RSI) indicates neutral-to-slightly bullish momentum, with room for upward movement. Additionally, the MACD shows a potential bullish crossover, signaling a possible shift in momentum if the trend continues.
More By This Author:
RippleNet And XRP In Visa’s Strategy For Digital Currency Future
XRP Price Prediction: Why Experts Think XRP Could Hit $1 Million
Nintendo To Hike US Switch Console Prices Amid Tariff Pressures


Comments
Log in or sign up to join the conversation.