Wednesday, November 27, 2019 3:00 PM EST
After suffering weeks of losses, the outlook for Bitcoin may have just turned bullish with the formation of an inverse head and shoulders pattern. Employing a band of support from May as the neckline, brief probes beneath $7,000 have created two shoulders and a head – creating an almost textbook formation of the bullish indicator. Since inverse head and shoulder patterns typically denote a bottom, Bitcoin could enjoy a brief respite from its longer-term downtrend, but it becomes a question of how far, and for how long, Bitcoin bulls will push the cryptocurrency – if at all.
BITCOIN PRICE CHART: 4 - HOUR TIME FRAME (NOVEMBER 11 – NOVEMBER 27) (CHART 1)
(Click on image to enlarge)
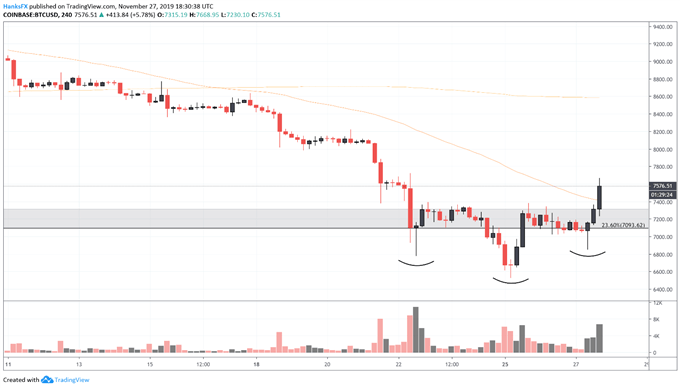
Given the distance between the top of the neckline and the head, it could be argued the formation may drive Bitcoin as high as $8,100 – but this is far from certain. Further still, traders typically look for a surge in volume to accompany the initial break above the neckline, an aspect that could have been stronger in this particular instance. Still, amidst a bleak outlook, the formation should be a welcome sign for believers in the largest cryptocurrency by market cap.
That being said, I still maintain my bearish bias for the coin’s medium-term outlook. To that end, Bitcoin’s presence beneath support that I previously highlighted at $7,000 and $6,500 – albeit brief – speaks to the continued strength of bears.
Disclaimer: DailyFX, the free news and research website of leading forex and CFD broker FXCM, delivers up-to-date analysis of the ...
more
Disclaimer: DailyFX, the free news and research website of leading forex and CFD broker FXCM, delivers up-to-date analysis of the fundamental and technical influences driving the currency and commodity markets. With nine internationally-based analysts publishing over 30 articles and producing 5 video news updates daily, DailyFX offers in-depth coverage of price action, predictions of likely market moves, and exhaustive interpretations of salient economic and political developments. DailyFX is also home to one of the most powerful economic calendars available on the web, complete with advanced sorting capabilities, detailed descriptions of upcoming events on the economic docket, and projections of how economic report data will impact the markets. Combined with the free charts and live rate updates featured on DailyFX, the DailyFX economic calendar is an invaluable resource for traders who heavily rely on the news for their trading strategies. Additionally, DailyFX serves as a portal to one the most vibrant online discussion forums in the forex trading community. Avoiding market noise and the irrelevant personal commentary that plague many forex blogs and forums, the DailyFX Forum has established a reputation as being a place where real traders go to talk about serious trading.
Any opinions, news, research, analyses, prices, or other information contained on dailyfx.com are provided as general market commentary, and does not constitute investment advice. Dailyfx will not accept liability for any loss or damage, including without limitation to, any loss of profit, which may arise directly or indirectly from use of or reliance on such information.
less
How did you like this article? Let us know so we can better customize your reading experience.


The recent volatility with #Bitcoin has really been turning me again #cryptos. $BITCOMP