

Bitcoin chart analysis
This morning, Bitcoin’s price fell to $60,760, forming a new two-week low. During the weekend, the price tested support at $65,000 but managed to hold above and climb up to the $68,900 level. There, we encounter the EMA200 moving average, which does not allow us to move above it.
This led to a new bearish consolidation yesterday and a price drop below $67,000. We continued to retreat below the weekend support at $65,000, descending to a new low of $61,897. After that, we saw an attempt to consolidate in that zone, but we didn’t have the strength to start a recovery. A new price drop occurred, forming a new weekly low of $60760.
(Click on image to enlarge)
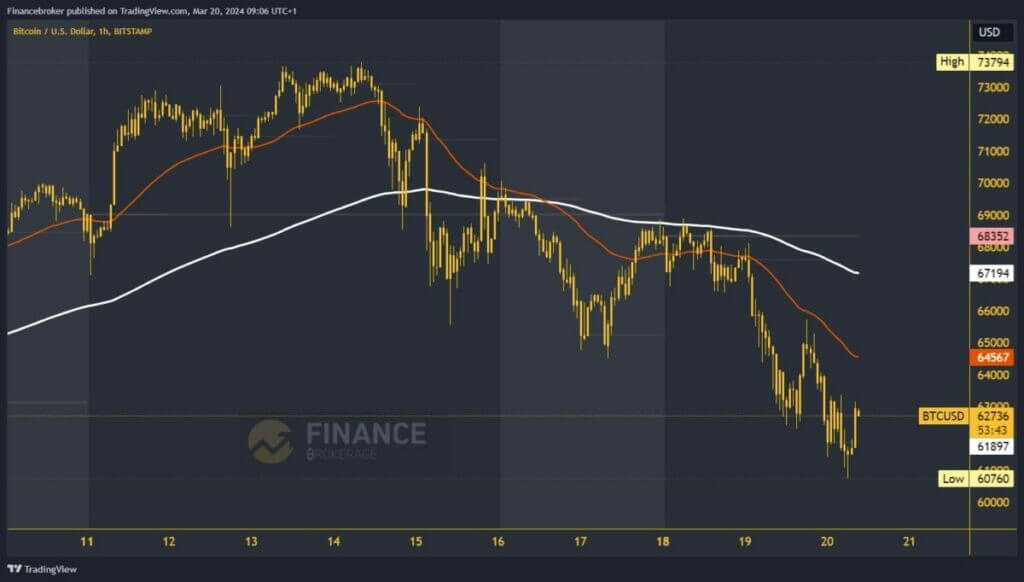
Is Bitcoin going below $60000, or will it manage to gain support?
Potential lower targets are the $60500 and $60000 levels. We managed to get support at that level and return above the $61000 level. Now, we see a good bullish impulse pushing us to the $63100 level. If we manage to hold above $63000, we will have the opportunity to initiate a bullish consolidation and recovery of Bitcoin.
By returning above $64,000 and testing the $65,000 level, we would get good indications of a return to the bullish side. In the zone around $64000, we come across the EMA50 moving average. Then, we need to maintain above or in the zone around $65,000 to form a bottom, from which we would have the opportunity for further recovery with a new impulse. Potential higher targets are the $66000 and $67000 levels. In the zone around $67000, we meet the EMA200 moving average again.
More By This Author:
Solana’s Impressive Surge: Breaking $200 And BeyondDogecoin And Shiba Inu: Dogecoin In Pullback Below 0.13000
Ethereum And Aevo: $16.6m ICO Fuels DeFi Innovation



Comments
Log in or sign up to join the conversation.