

Image Source: Unsplash
Bitcoin price is consolidating above the $96,200 support zone. BTC is showing a few positive signs and might attempt to rally above $99,000.
- Bitcoin started a decent recovery wave above the $95,000 level.
- The price is trading above $96,000 and the 100 hourly Simple moving average.
- There is a connecting bearish trend line forming with resistance at $98,000 on the hourly chart of the BTC/USD pair (data feed from Kraken).
- The pair could start another increase if it clears the $98,000 zone.
Bitcoin Price Eyes Fresh Increase
Bitcoin price failed to continue higher above the $100,500 zone. It started another decline below the $97,500 zone. BTC gained bearish momentum for a move below the $96,000 and $95,000 levels.
There was also a spike below the 61.8% Fib retracement level of the upward wave from the $91,000 swing low to the $102,500 high. The price tested the $95,000 zone and recently recovered some losses. There was a move above the $96,000 level.
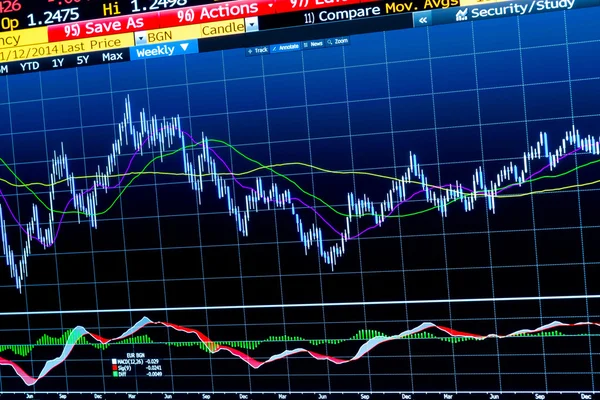
Bitcoin price is now trading above $97,000 and the 100 hourly Simple moving average. On the upside, immediate resistance is near the $98,000 level. There is also a connecting bearish trend line forming with resistance at $98,000 on the hourly chart of the BTC/USD pair.
(Click on image to enlarge)

The first key resistance is near the $99,000 level. The next key resistance could be $100,000. A close above the $100,000 resistance might send the price further higher. In the stated case, the price could rise and test the $101,200 resistance level. Any more gains might send the price toward the $102,500 level.
Another Decline In BTC?
If Bitcoin fails to rise above the $98,000 resistance zone, it could start a fresh decline. Immediate support on the downside is near the $96,500 level. The first major support is near the $95,500 level.
The next support is now near the $93,700 zone or the 76.4% Fib retracement level of the upward wave from the $91,000 swing low to the $102,500 high. Any more losses might send the price toward the $92,000 support in the near term. The main support sits at $91,000.
Technical indicators:
Hourly MACD – The MACD is now gaining pace in the bullish zone.
Hourly RSI (Relative Strength Index) – The RSI for BTC/USD is now above the 50 level.
Major Support Levels – $96,500, followed by $95,500.
Major Resistance Levels – $98,000 and $100,000.
More By This Author:
Ethereum Holds ‘Bounce Or Die’ Level: Rebound To $4,000 Could Be Near
Dogecoin Drifts Sideways — Will Bulls Step Up To The Challenge?
Bitcoin Funding Rate Turns Neutral On Top Exchanges: What Happened Last Time


Comments
Log in or sign up to join the conversation.