Bitcoin Looking To Extend Higher
Image Source: Unsplash
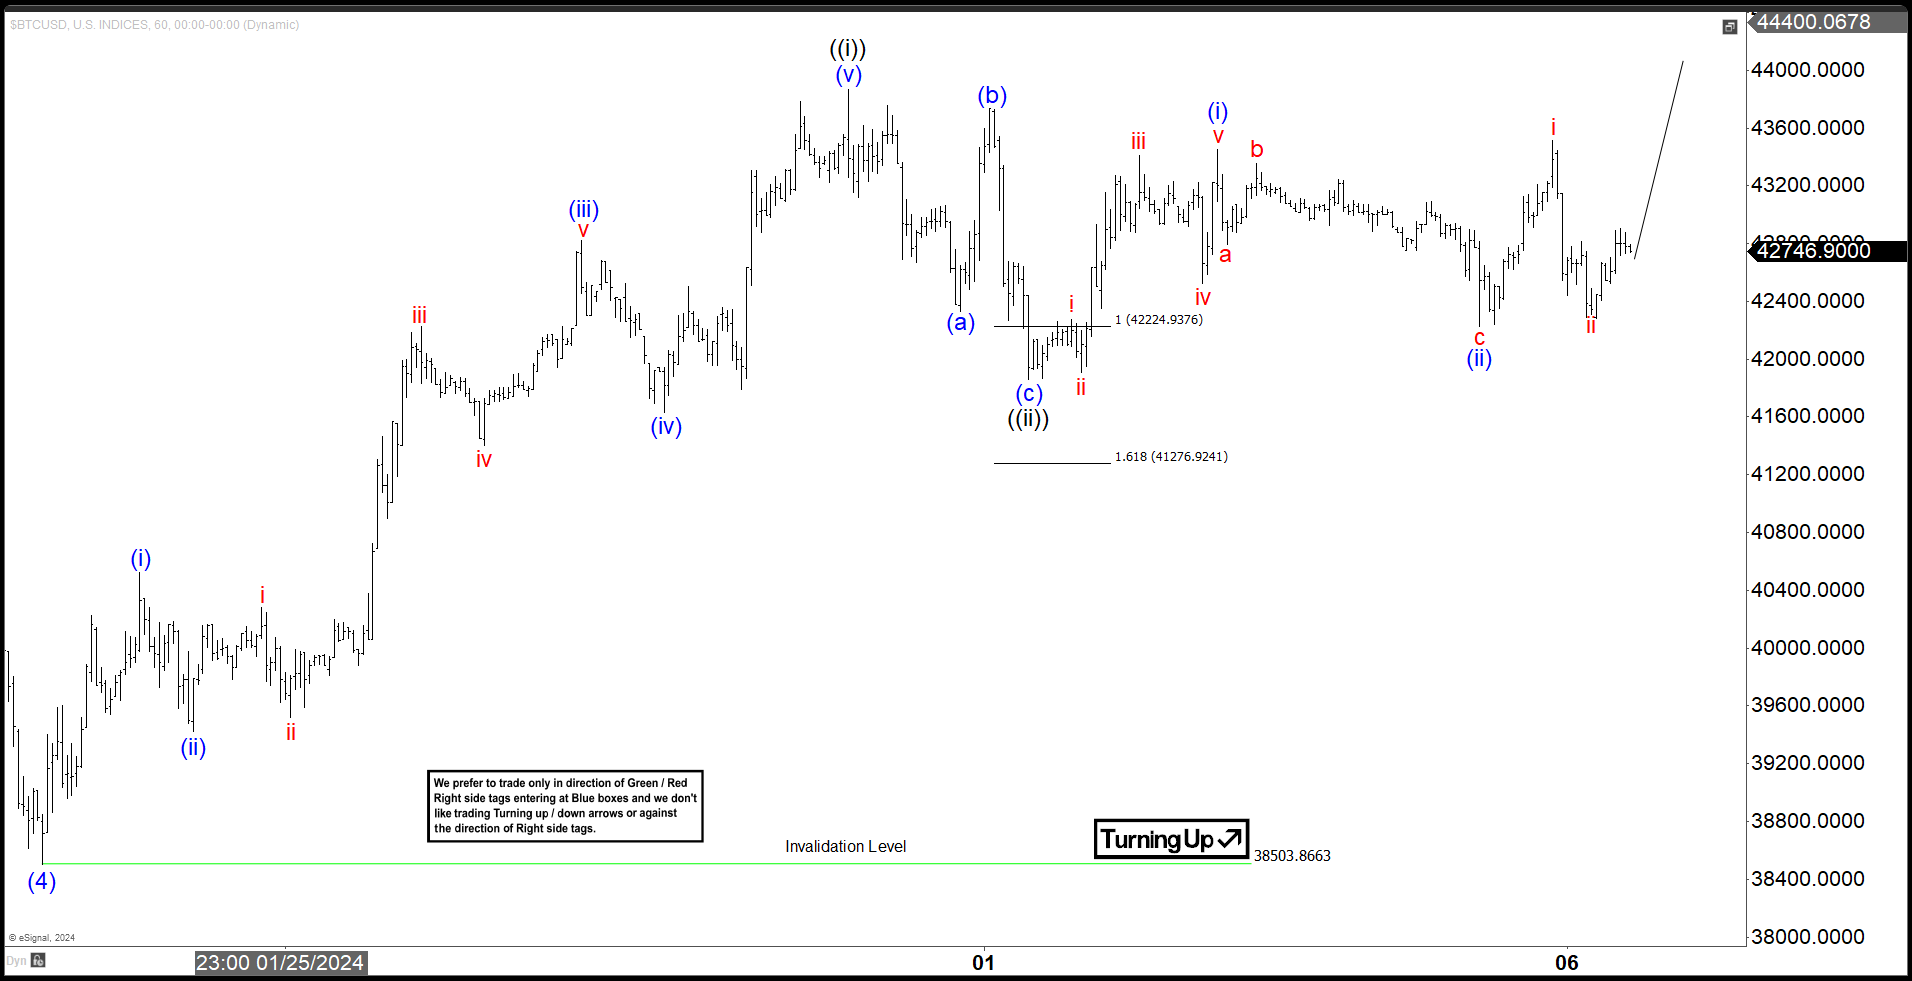
Short Term Elliott Wave view in Bitcoin (BTCUSD) suggests the rally to 49500 on January 11, 2024 ended wave (3). Pullback in wave (4) is proposed complete at 38503.8 as the 1 hour chart below shows. Up from wave (4), wave (i) ended at 40526.3 and pullback in wave (ii) ended at 39419.8. The crypto currency then extended rally higher in wave (iii) towards 42823.2 and pullback in wave (iv) ended at 41628.6. Final leg higher wave (v) ended at 43865 which completed wave ((i)) in higher degree. Bitcoin then pullback in wave ((ii)) towards 41856.4 with internal subdivision as a zigzag Elliott Wave structure.
Down from wave ((i)), wave (a) ended at 42333.2 and wave (b) ended at 43733.2. Wave (c) lower ended at 41856.4 which completed wave ((ii)). Bitcoin then turned higher in wave ((iii)). Up from wave ((ii)), wave (i) ended at 43448.4 and dips in wave (ii) ended at 4224. Near term, while Bitcoin stays above wave ((ii)) low, expect the crypto currency to extend higher. As far as pivot at 38503.8 low stays intact, expect pullback to find support in 3, 7, or 11 swing for further upside.
Bitcoin 60 Minutes Elliott Wave Chart
BTCUSD Elliott Wave Video
Video Length: 00:07:28
More By This Author:
USDJPY : 1:5 Risk/Reward Target HitBTCUSD Found Buyers At The Equal Legs Area
DAX Near Term Support Area
Disclaimer: Futures, options, and over the counter foreign exchange products may involve substantial risk and may not be suitable for all investors. Leverage can work against you as well as for ...
more


