Bitcoin, Ethereum Slide On Turkish Ban, Dogecoin Goes Ballistic, Up 500%+ In A Week

BITCOIN (BTC/USD), ETHEREUM (ETH/USD), AND DOGECOIN (DOGE/USD) PRICE, ANALYSIS AND CHART:
- Bitcoin, Ethereum nudge lower on Turkey ban.
- Dogecoin goes ballistic, the rise and rise of alt-coins.
A week, when Bitcoin and Ethereum hit fresh record highs is ending on a downtick after Turkey said that they will ban cryptocurrency payments. The Turkish central bank said the ban, which comes into place on April 30, was due to the irrevocable risks that surround cryptocurrency transactions and that their ‘market values can be excessively volatile’. While this news is stemming the latest rally, any further profit-taking in the space will likely be seen as another opportunity to enter the market at more favorable levels. As always, care should be taken over the weekend sessions, even in this 24/7 market, as reduced liquidity can lead to sharp moves.
THE RISE AND RISE OF ALT-COINS – DOGECOIN SOARS
This week’s star performer and media headline-grabber is meme darling Dogecoin which has soared from just over 6 cents to a current level of 38 cents in the last seven days, a rise in excess of 500%. The token, a favorite of Tesla founder Elon Musk, has more than doubled today - giving it a market capitalization of $48 billion - helped by yet another bullish tweet by Musk. When you get 273k Twitter likes, you know your message is hitting home. Any kind of serious technical analysis on Dogecoin is moot at this point with price action driven solely by various cryptocurrency Reddit boards, StockTwits, and Elon Musk’s musings.
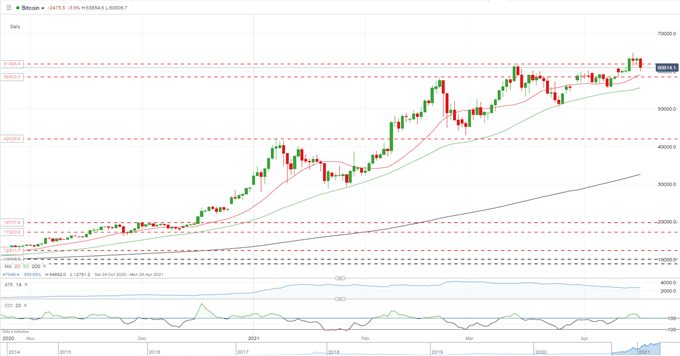
Bitcoin is edging lower on the day but remains positive for the week, just, on the Turkish central bank news, but as can be seen on the daily chart, any recent sell-off has been seen as an opportunity to enter, or re-enter, the market. The chart shows an unbroken sequence of bullish waves of higher highs and higher lows and as long as this pattern remains in place then higher prices look likely. If the sell-off continues, a support zone between $58,400 and $59,200 (20-day sma) will come into play ahead of the April 7 swing-low at $55530.
BITCOIN (BTC/USD) DAILY PRICE CHART (OCTOBER 2020 – APRIL 16, 2021)
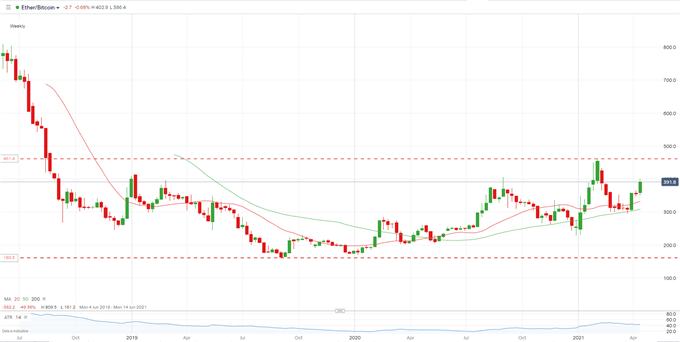
Ethereum is another outperformer of late and continues to make new highs. The Ethereum/Bitcoin spread is nearing 0.0400 again, after having traded as low as 0.01605 in early September last year, showing Ethereum’s outperformance over the past months.
ETHEREUM/BITCOIN SPREAD WEEKLY CHART (JULY 2020 – APRIL 16, 2021)
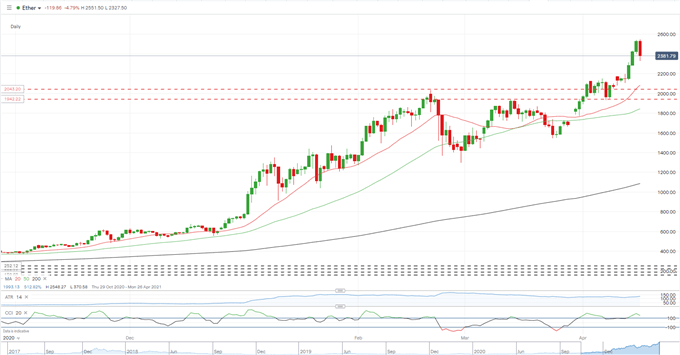
The daily Ethereum chart remains positive on the week, despite today’s sell-off with a cluster of recent highs and lows on either side of $2,100 as an area of potential support if the sell-off deepens. All three moving averages remain in a bullish set-upand, as with Bitcoin, higher prices are likely going forward.
ETHEREUM (ETH/USD) DAILY PRICE CHART (NOVEMBER 2020 – APRIL 16, 2021)
Disclosure: See the full disclosure for DailyFX here.


Clearly, all it would take to get rid of the crypto currency would be to declare it unacceptable for any dealings with the US government, and for the states to follow suit.