
Bitcoin chart analysis
The price of Bitcoin fell to $55,650 yesterday, thus testing the weekly low at $55,600. We received new support and started a recovery to the $56800 level. That is today’s high, and for now, we have resistance at that level. We see a new pullback from there to new support at $56250. If we manage to stay there, we will have the opportunity to start a bullish consolidation above today’s high.
There, we should get support from the EMA 50 moving average for further progress on the bullish side. At $57,300, we will test the weekly open price, which was strong resistance to us in yesterday’s attempt. This time, we hope to break above and move to the positive side. Bitcoin would have to form a new bottom there, from which it would continue to grow to higher levels.
(Click on image to enlarge)
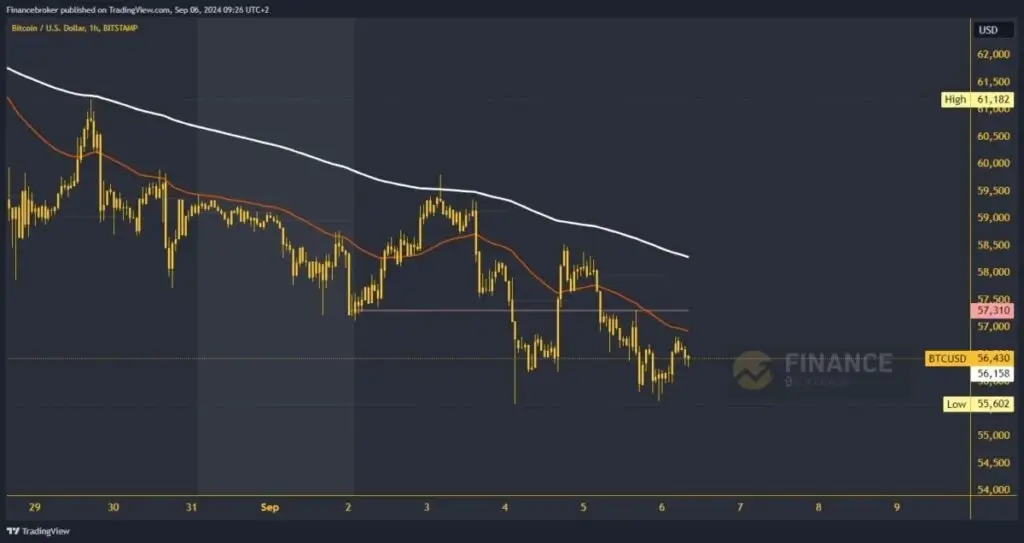
The price remains on the bearish side, putting pressure on the support zone
Potential higher targets are $58000 and $58500 levels. EMA 200 could be the next major resistance to a further bullish advance in the $58250 zone. For a bearish option, we need a negative consolidation and a pullback of the price again below the $56000 level. We move below the daily open price and then put pressure on this morning’s low.
It would be our third visit to this zone, and this time, we could see a further pullback in the price of Bitcoin to a new weekly low. Potential lower targets are the $55500 and $55000 levels. With that, we retreat to a new September low.
More By This Author:
Dogecoin And Shiba Inu: Doge Is In A Sideways ConsolidationEthereum fell this morning below last week’s support zone
Solana And Cardano: Solana Loses Momentum Again


Comments
Log in or sign up to join the conversation.