
Bitcoin (BTC/USD) Pulls Back, Remains Bullish With Breakout Potential
The last time I had written about Bitcoin, the crypto-currency had just seen a pullback through short-term support levels after a ban warning from hedge fund magnate, Ray Dalio. But, as noted at the time, there was an enormous zone of support lurking underneath current price action around the psychological level of 50k. And with a market like Bitcoin, where many retail traders are making prognostications, psychological levels can bring large impact because Bitcoin trading at $49,999 seems much cheaper than just two dollars less than $50,001.
Bitcoin bulls did not fail to impress, however, as that low was carved out before a test below the 50k marker. Instead – less than a week later, Bitcoin was budging up against another psychological level at 60k that still remains resistant. Bulls have tested above this level in early March, albeit briefly; and since then there’ve been multiple failed breakout attempts at this price on the chart.
BITCOIN (BTC/USD) FOUR-HOUR PRICE CHART
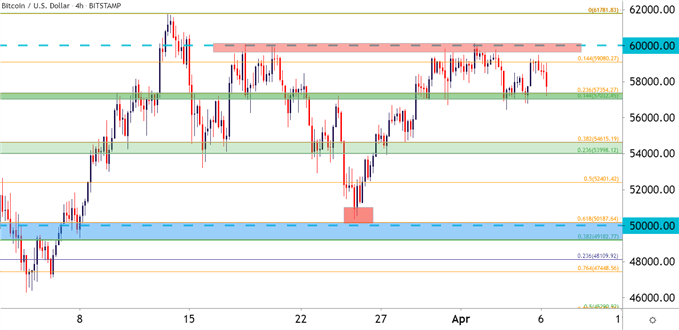
Chart prepared by James Stanley; Bitcoin on Tradingview
BITCOIN BREWING FOR BULLISH BREAKOUT?
You may notice from that above chart the ‘v-shaped’ setup that developed in late-March, initially driven by the same dip I talked about two weeks ago, with buyers stepping in and pushing prices right back up to that 60k resistance.
This also begins to look very similar to a bullish breakout pattern known as an inverse head and shoulders pattern. The neckline and heads are there, but the shoulders would be a bit soft, at least in my opinion, to consider this a legitimate inverse head and shoulders pattern.
But, there’s similar tonalities in the current Bitcoin setup: A consistent area of horizontal resistance marking an area similar to a ‘neckline.’ There’s a v-shaped move that could make up a ‘head’ of that formation. And while the shoulders are lacking, the backdrop is showing a very similar dynamic that opens the door to bullish breakout potential.
But what makes the current backdrop in Bitcoin so exciting is the same thing that brings exhilaration to the inverse head and shoulders pattern: Persistence. In both the case of our current setup in Bitcoin and the inverse head and shoulders pattern – the big item of drive is bullish persistence, even after price action took a swan-dive a couple of weeks ago. Buyers reacted – pushed right back to resistance, and that same bullish enthusiasm may eventually drive through for a sustained break through the 60k level.
On a shorter-term basis, price action is testing a confluent spot of support, denoted by two Fibonacci levels, spanning from 57,032-57,354. Below that, another area of support potential appears around 53,998-54,615.
BITCOIN (BTC/USD) TWO-HOUR PRICE CHART
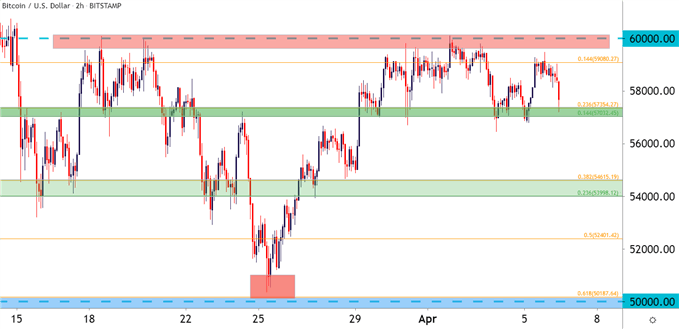
Chart prepared by James Stanley; Bitcoin on Tradingview
Disclosure: See the full disclosure for DailyFX here.


