
Bitcoin (BTC/USD) Prices Test Resistance, Risk Sentiment Bolsters Gains

WILL RISK-ON SENTIMENT DRIVE BITCOIN HIGHER?
Bitcoin prices have edged slightly higher as a culmination of factors boost the demand for riskier assets. Over the past month, fears over the rapid spread of the Omicron variant, regulatory concerns and rising inflation have weighed on the industry, allowing bears to dominate the systemic, prominent trend.
However, after falling by approximately 30% since the November all-time high, failure to break below $44,000 has allowed bulls to temporarily find support above the $48,000 handle.
As the safe-haven Dollar continues to remain under pressure, positive economic data and calming fears surrounding the new variant has allowed stocks and crypto’s to limit further losses, raising the prospect of a delayed ‘Santa Claus’ rally.
Due to supply constraints, energy prices have continued to surge, proving to be a contributing factor to the rise in inflation. However, as major central banks such as the ECB (European Central Bank), the Fed ( US Federal Reserve) and the BoE (Bank of England) prepare to tackle inflation, both technical and fundamental factors may further assist in the catalyzation of price action for the imminent move.
BITCOIN TECHNICAL ANALYSIS
Over the past three weeks, Bitcoin prices have been trading in a confluent zone, formed by the key Fibonacci levels of the April – June 2021 move which continues to provide both support and resistance for the imminent move.
With price action currently testing trendline resistance, Bitcoin prices have temporarily risen above the key psychological level of $50,000 driving the CCI (commodity channel index) towards over-sold territory.
Bitcoin (BTC/USD) Daily Chart
(Click on image to enlarge)
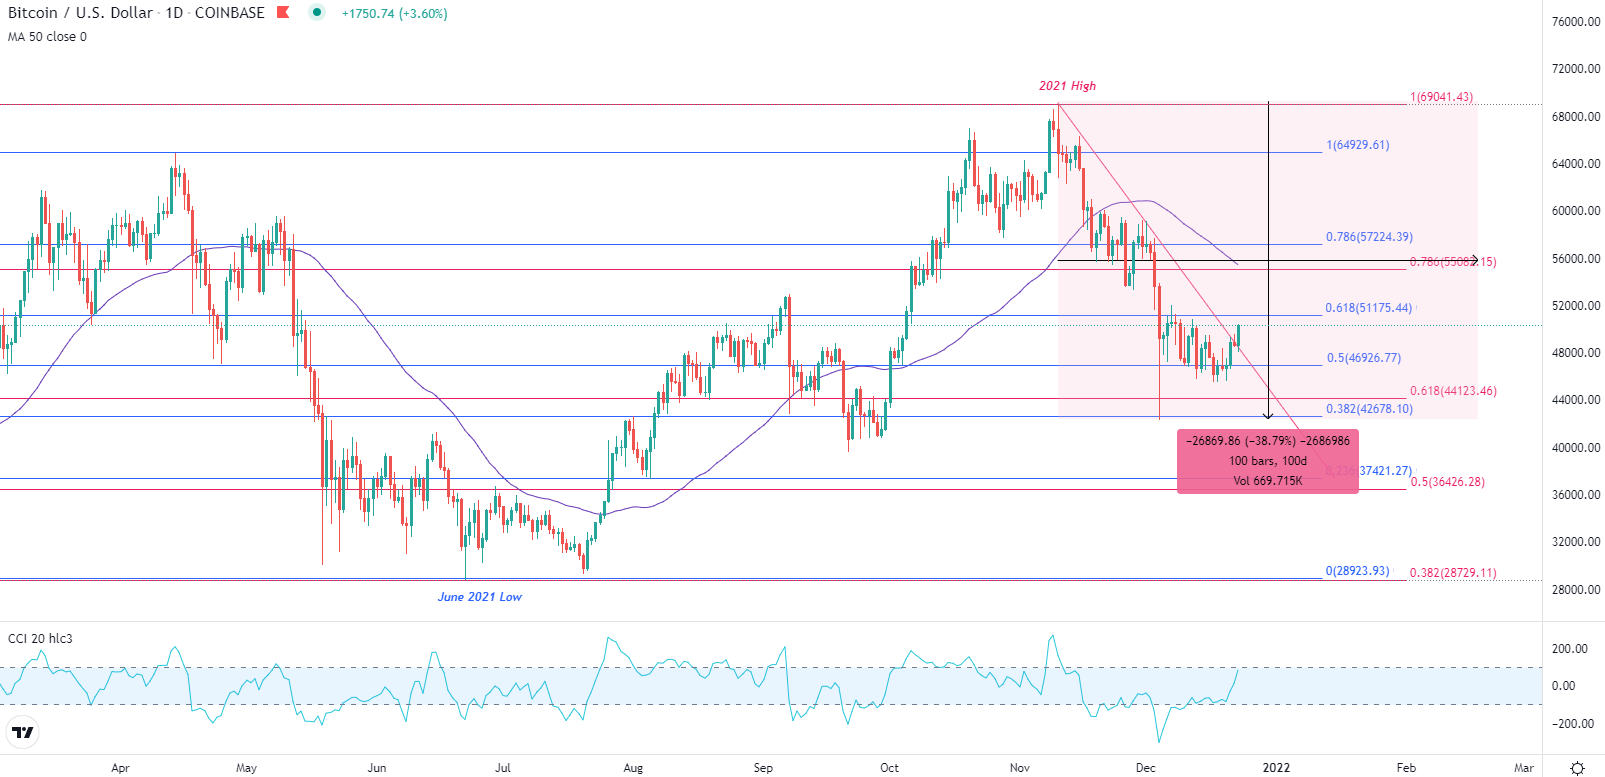
Chart prepared by Tammy Da Costa using TradingView
Although the downward trajectory currently remains intact, price action continues to linger above the 50-period moving average on the weekly chart while the commodity channel index (CCI) remains within range.
Bitcoin (BTC/USD) Weekly Chart
(Click on image to enlarge)
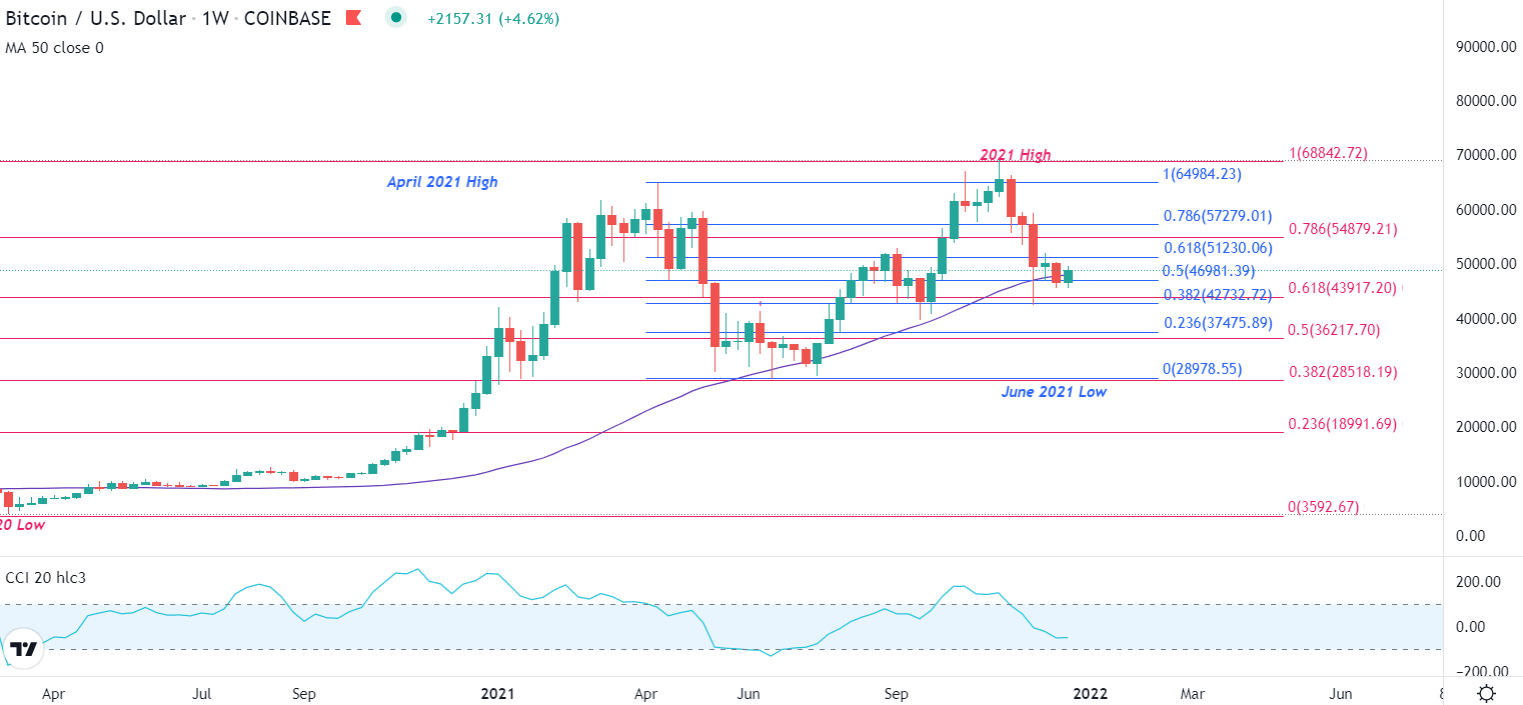
Chart prepared by Tammy Da Costa using TradingView
Disclaimer: See the full disclosure for DailyFX here.


