
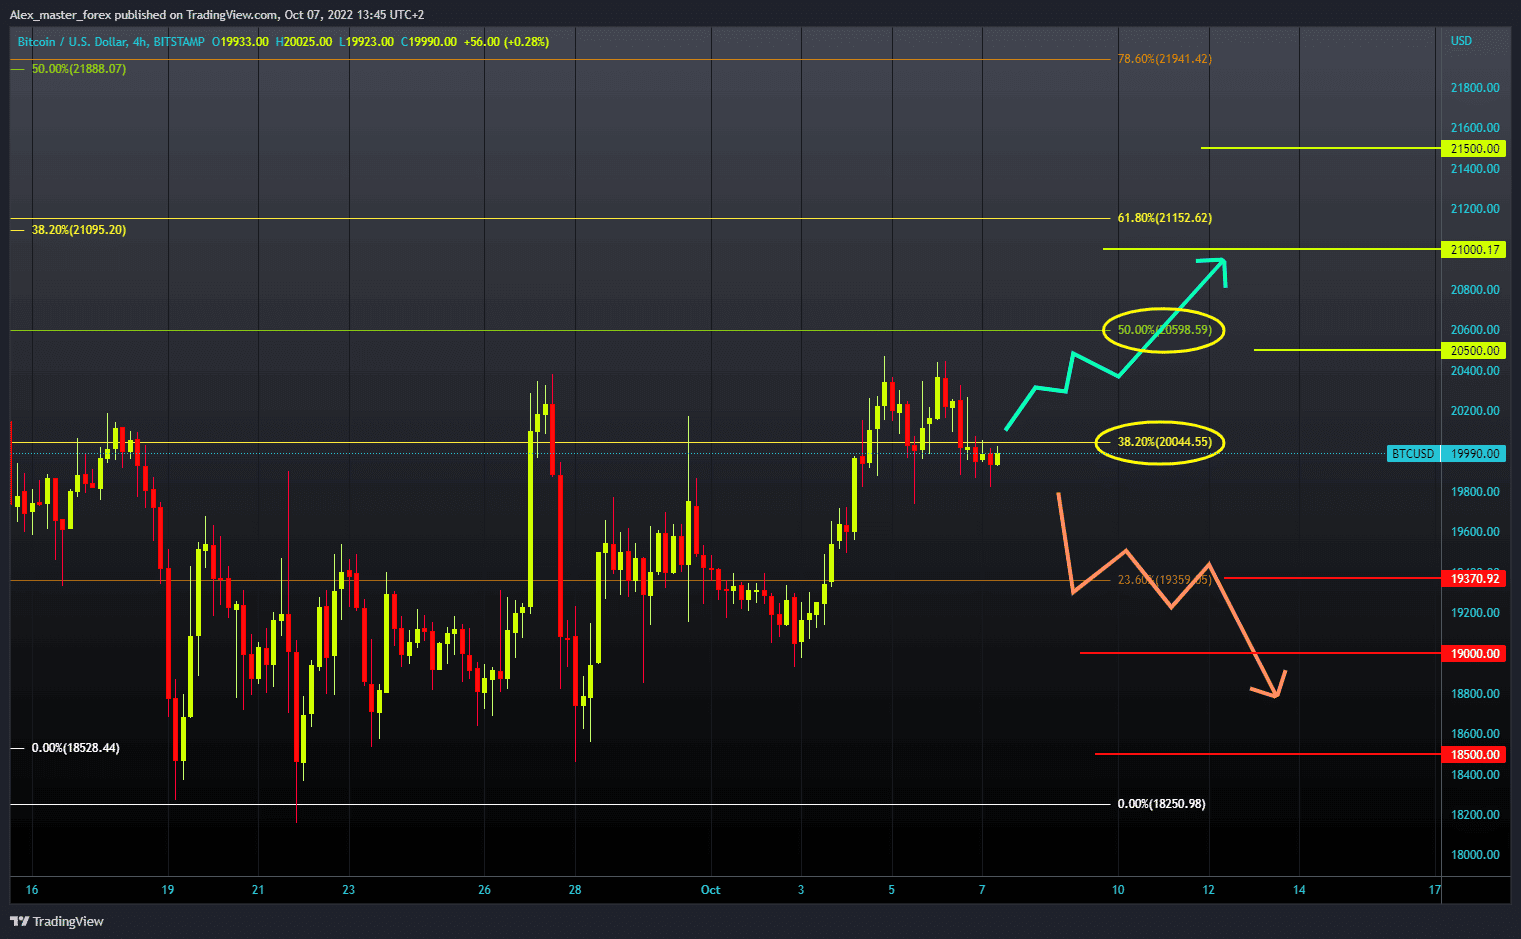
Bitcoin chart analysis
Bitcoin price pulled back from its October high of $20,500 yesterday and is now trying to hold in the $20,000 zone ahead of the NFP report. Depending on the report, so will the price of Bitcoin. We need further negative consolidation and continued price pullback for a bearish option. Potential lower targets are $19,500 and $19,000 support levels. For a bullish option, we need a new positive consolidation and a return to the upper resistance zone around the $20500 level. Then we need to try to maintain ourselves up there so that we can find the strength to move out of the uncomfortable zone with a new bullish impulse. We need to move to a higher movement zone of $20500-21000. Only then could the price advance and climb to higher levels on the chart.
(Click on image to enlarge)
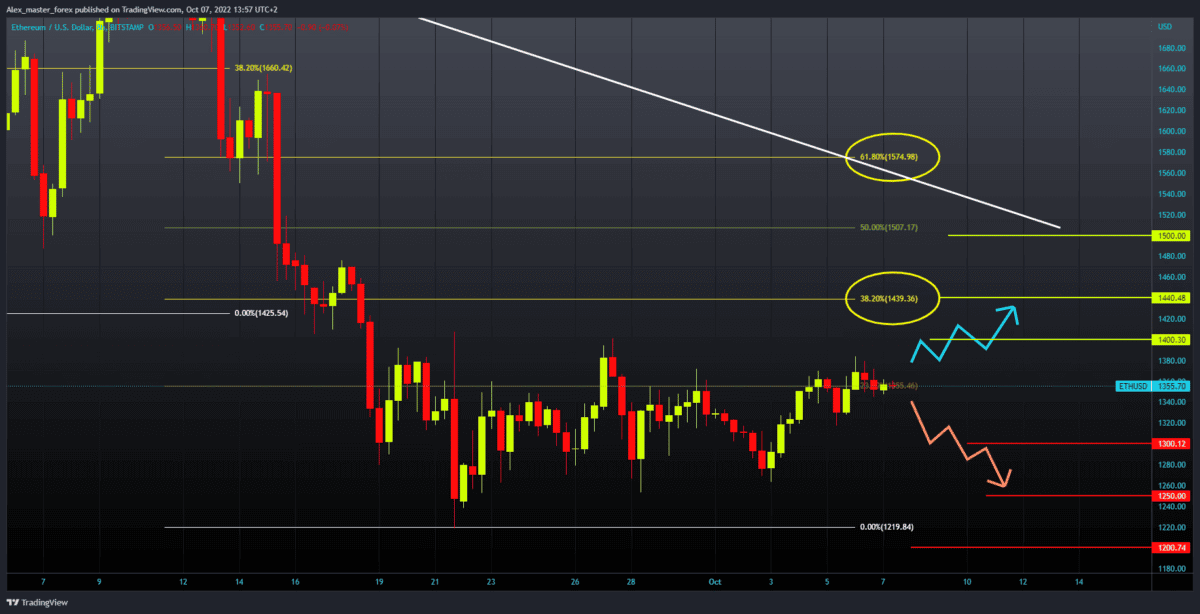
Ethereum chart analysis
The price is currently stable at $1350 without major fluctuations. The current price movement has moved up compared to the previous days, and if this trend continues, we could soon find ourselves at the $1400 level. The last time we were there was September 21. For such a thing, we need the continuation of this positive consolation. A potential higher target is the $1440 level at 38.2% Fibonacci. For a bearish option, we need a drop in the price of ETH to the 1300 support level. And if he doesn’t support us either, then we go down to the September support zone of $1200-$1250.
(Click on image to enlarge)
More By This Author:
EURUSD and GBPUSD: The New Lower Low LevelThe New PoS Consensus for Ethereum
EURUSD And GBPUSD: Prices Could Go Down Again


Comments
Log in or sign up to join the conversation.