
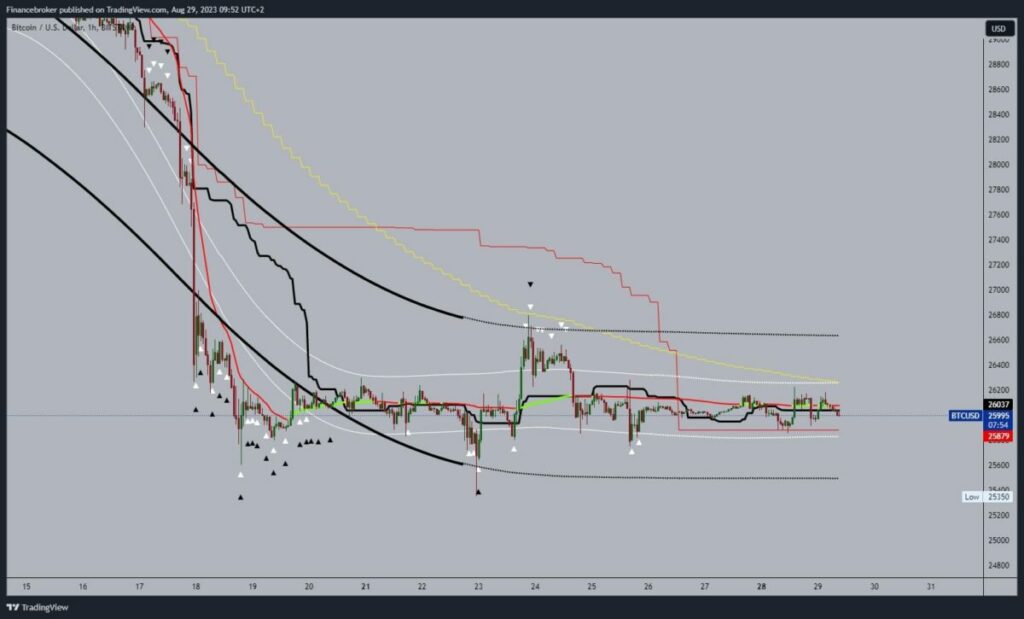
Bitcoin chart analysis
Yesterday, there were no major changes on the chart, and the price of Bitcoin was moving in the $25900-$26200 range. We are currently below the $26,000 level and could revisit the $25,900 level of support. A break below that level would take us down to $25800, the next support. If we do not manage to fight at that level either, the price will continue to retreat, forming a new low. Potential lower targets are $25700 and $25600 levels.
We need a positive consolidation and a jump to the $26200 resistance level for a bullish option. Then, we need a break above to continue to the bullish side. Additional resistance at that level is the EMA50 moving average. Potential higher targets are $26400 and $26600 levels.
(Click on image to enlarge)
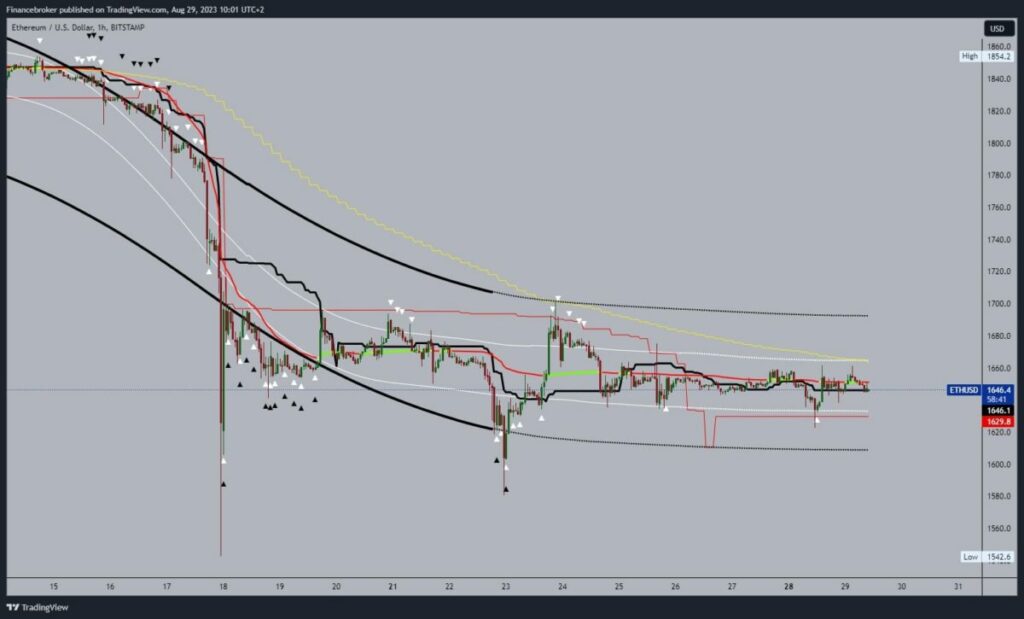
Ethereum chart analysis
Ethereum price continues to consolidate sideways today. We are moving into the $1620-$1660 range for the fourth day in a row. In the zone around the $1660 level, we have additional resistance in the EMA50 moving average, and we need a break above it in order to start a more concrete recovery. Potential higher targets are $1680 and $1700 levels.
We need a price drop to the $1620 support level for a bearish option. A break below would mean that the price does not have the strength to hold there, and we will see a continuation to the bearish side. Potential lower targets are $1600 and $1580 levels.
(Click on image to enlarge)
More By This Author:
Gold And Silver: The Gold Is Maintained At Around $1915Bitcoin And Ethereum: Bitcoin Slips Below The $25900 Level
Bitcoin And Ethereum: Bitcoin Again At The $26000 Level


Comments
Log in or sign up to join the conversation.