
Bitcoin chart analysis
Today’s Bitcoin price movement is in the $29100-$29200 range. Yesterday, we had one jump to $29400, but we quickly returned to the previous movement zone. The price is still attracted by the $29,000 level, which does not allow it to start a recovery.
We need a positive consolidation and a new jump to $29400 to start a new bullish option. Then, we need a breakout above, and we would jump above the EMA50 moving average. Potential higher targets are $29500 and $29600 levels.
We need a negative consolidation and pullback to the support at $29,000 for a bearish option. We need a break below to continue to the bearish side. Potential lower targets are $28900 and $28800 levels.
(Click on image to enlarge)

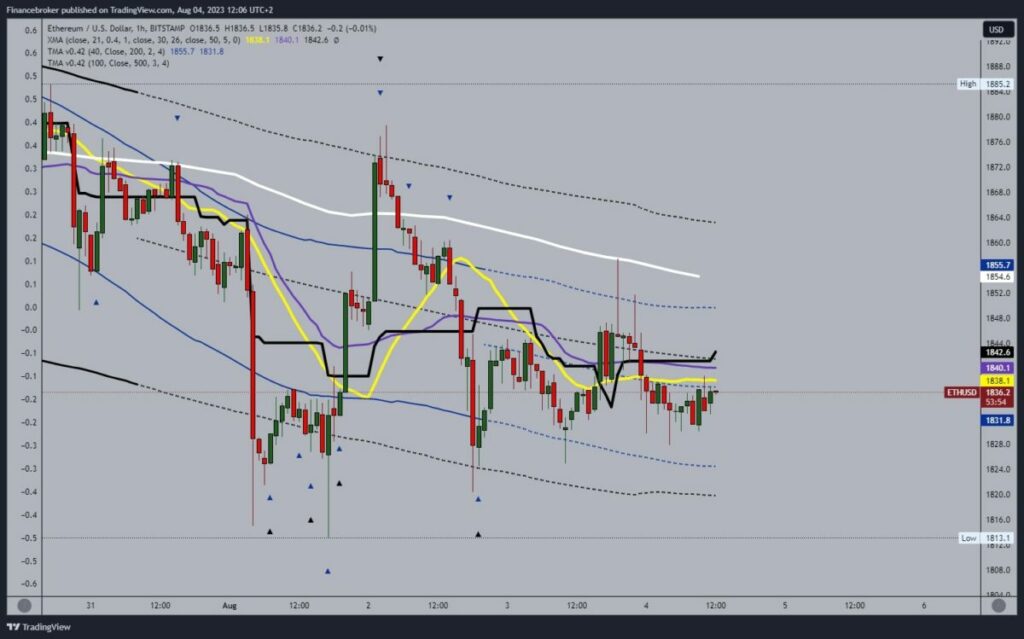
Ethereum chart analysis
Today’s low price of Ethereum is 1830$ level. We managed to hold above it and now expect to see a continuation to the bullish side. We need to break above the $1840 level and hold above it. This would lead to consolidation at that level, and the price of Ethereum would have a better position from which it could proceed to the bullish side. Potential higher targets are $1850 and $1860 levels.
We need a negative consolidation and a price pullback below the $1830 level for a bearish option. After that, I’m looking at the $1820 support level. Failure to hold above it would make prices break below and form a new lower low. Potential lower targets are $1810 and $1800 levels.
(Click on image to enlarge)
More By This Author:
Solana And Cardano: Cardano Slipped To 0.2925 TodayDogecoin And Shiba Inu: Dogecoin Retreats To 0.07250 Level
European Stock Futures Surge After ECB Meeting


Comments
Log in or sign up to join the conversation.