
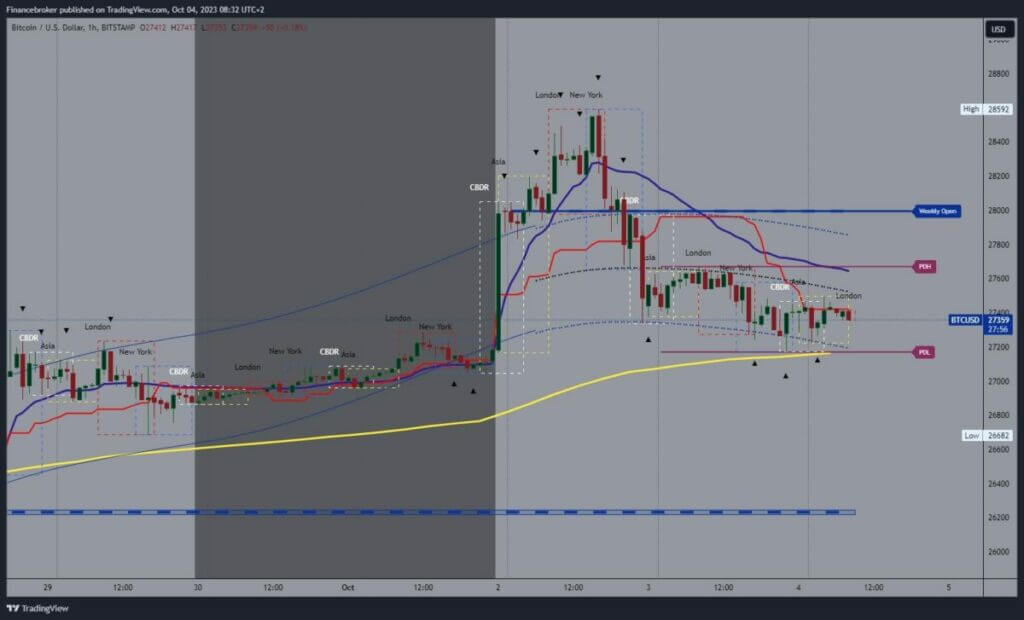
Bitcoin chart analysis
Today’s Bitcoin price movement is very similar to yesterday’s. The range of movement is in the $27200-$27500 range. Bitcoin is still under pressure, which could lower the price to support at the $27,200 level. Additional support in that zone is the EMA50 moving average. A break below would increase the bearish pressure to continue the decline to lower levels. Potential lower targets are $27000 and $26800 levels.
We need a positive consolidation and a jump above the $27500 level for a bullish option. Then, we need to hold ourselves there to create a better starting position for continued recovery. Potential higher targets are $27600 and $27800 levels.
(Click on image to enlarge)
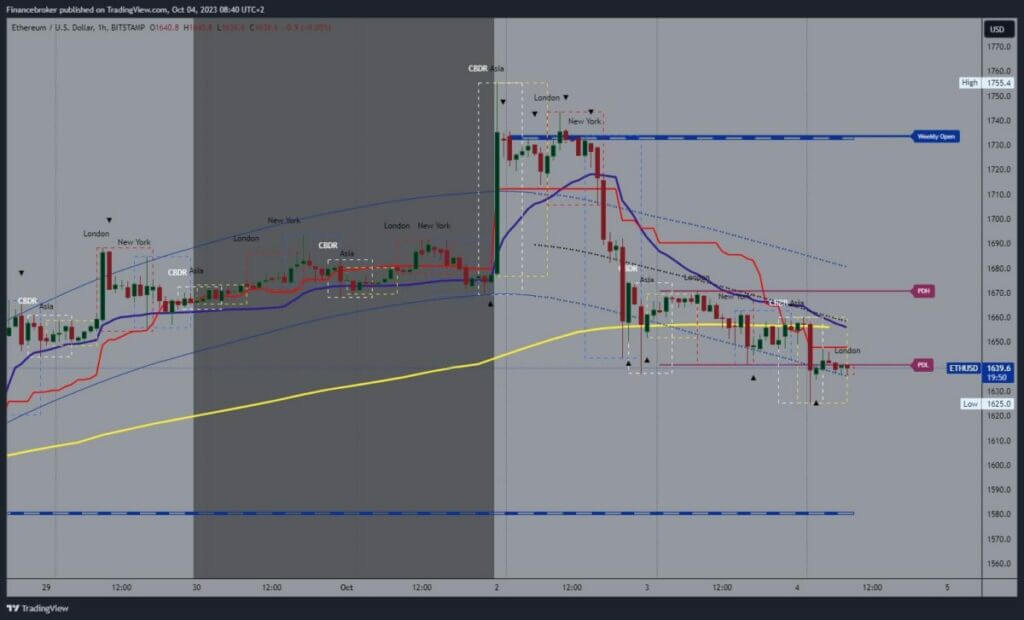
Ethereum chart analysis
This morning, we saw the formation of a new weekly Ethereum low at the $1625 level. Bearish consolidation continues after Monday’s jump to the $1755 level. Yesterday, the price began to press the EMA50 moving average, and this morning, we saw a break below and a further decline to the current low. This consolidation shows us that the bearish option is in place to continue until the end of the day. Potential lower targets are $1610 and $1600 levels.
We need a positive consolidation and a return above the $1660 level for a bullish option. Then, we would have to hold ourselves above that level to continue our recovery from there. Potential higher targets are $1670 and $1680 levels.
(Click on image to enlarge)
More By This Author:
Hot Commodity: Australia’s Resource Forecast OutlookDogecoin And Shiba Inu: Dogecoin Retreats From 0.06420
Solana And Cardano: Solana Stabilizes Above The 24.00 Level


Comments
Log in or sign up to join the conversation.