
The on-chain analytics firm CryptoQuant has explained why Bitcoin and Ethereum have recently appeared to be on a path towards acceleration.
Bitcoin & Ethereum Are Looking Bullish In On-Chain Metrics
In a new thread on X, the official CryptoQuant handle discussed how some important on-chain indicators are looking for Bitcoin and Ethereum right now.
The first two metrics of interest here keep track of the demand from the permanent holders and the whales. First, here are the relevant charts for BTC:
(Click on image to enlarge)
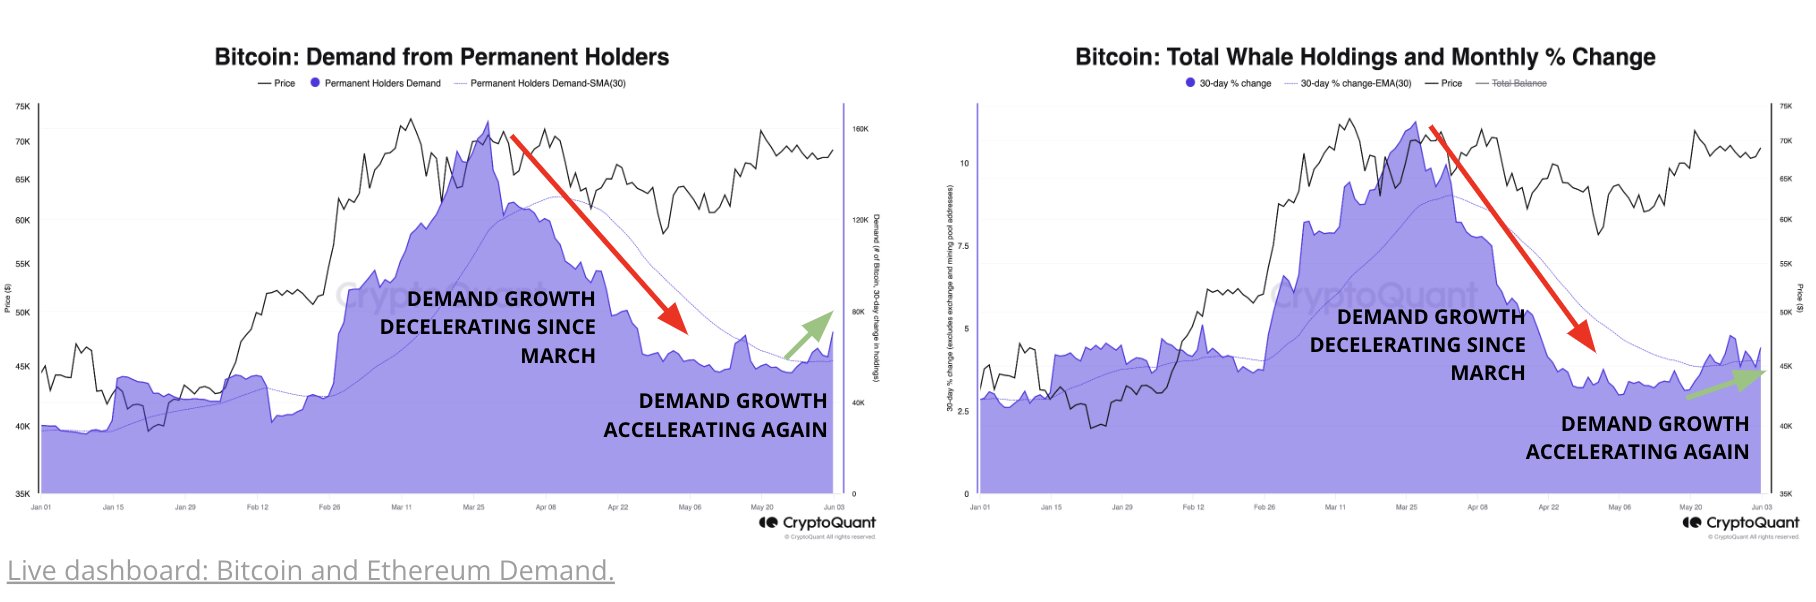
As is visible above, demand from the permanent holders, or the HODLers, had been going down after peaking in March, but recently, the metric has seen a turnaround. These investors have added 70,000 BTC to their wallets in the past month.
A similar trend has also been witnessed in the whales’ holdings, typically defined as addresses carrying more than 1,000 BTC. According to the analytics firm, the monthly demand from these large investors is up 4.4%.
CryptoQuant has also revealed that the sector is experiencing an influx of potentially new capital, as the “new whales” have seen their Realized Cap shoot up recently.
(Click on image to enlarge)
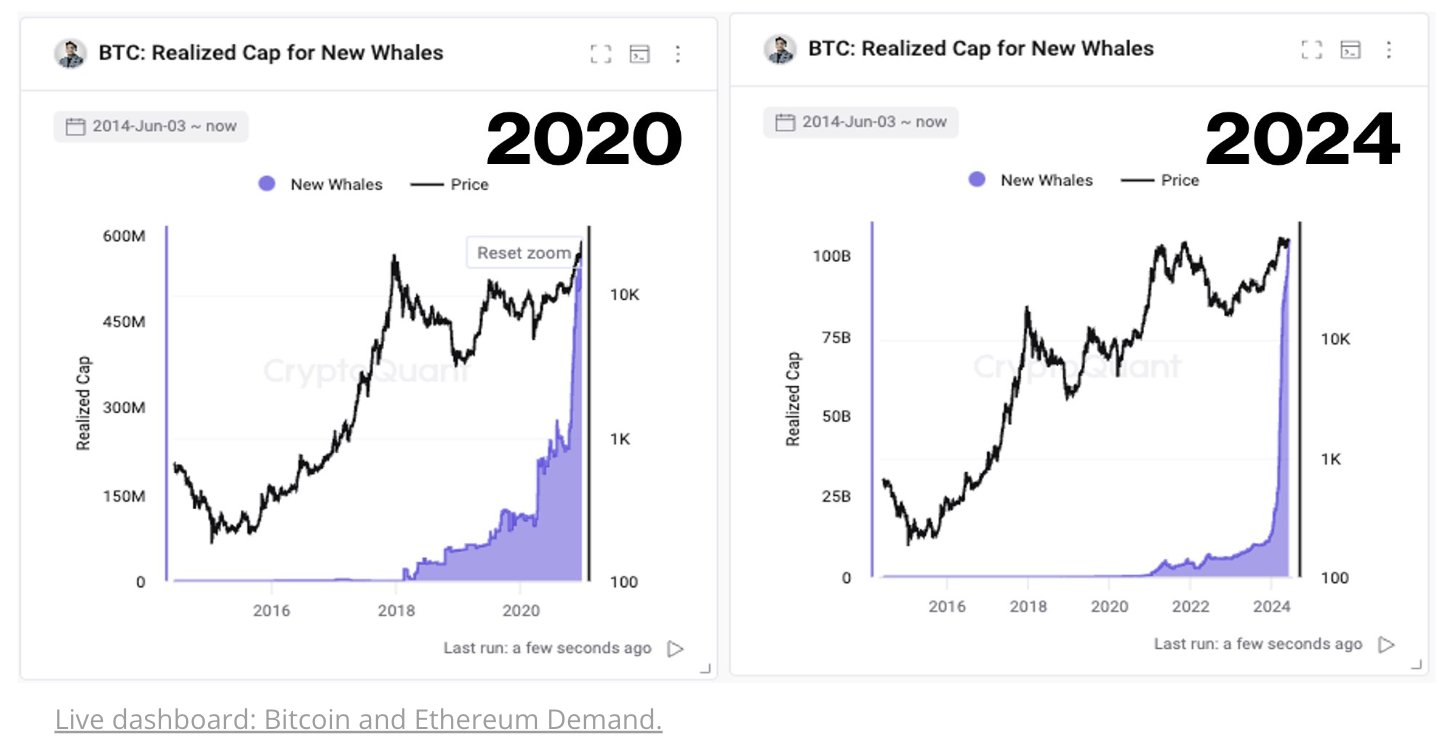
The Realized Cap measures the amount of capital a particular investor group uses to purchase their Bitcoin. Thus, the increase in the Realized Cap of the new whales, which are whale entities that have entered within the past 155 days, would represent the fresh demand from large investors coming into BTC.
As the charts above showcase, the pattern in this metric has looked similar this year to what was observed back in 2020. The demand that year led to the 2021 bull run.
Now, here is what the trend in the permanent holder inflows and whale balance has looked like for Ethereum:
(Click on image to enlarge)
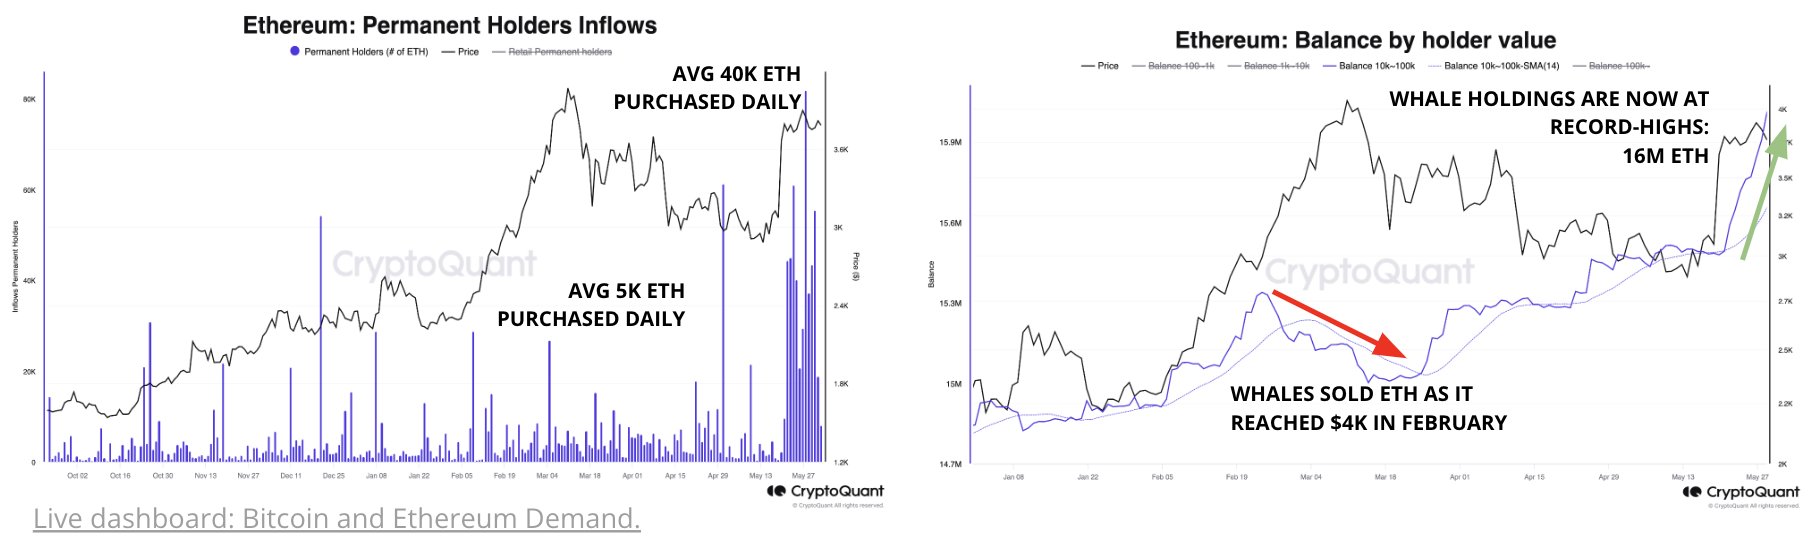
As the graphs show, demand for Ethereum from these investor groups has shot up since the spot exchange-traded fund (ETF) approvals last month.
The permanent holders are now making inflows of 40,000 ETH per day on average, while whales, the investors holding 10,000 to 100,000 ETH, have increased their holdings to record highs of around 16 million ETH.
While signs have been positive for Bitcoin and Ethereum in terms of direct demand, there is a development that may be detrimental to the cryptocurrency sector as a whole. It is the slowdown in the growth of the stablecoins.
(Click on image to enlarge)

The chart shows that the Tether (USDT) market cap grew sharply during the rally towards the Bitcoin all-time high. While the largest stablecoin still receives capital injections, its demand has slowed.
Historically, stablecoins have been one of the gateways for capital into the sector, so consistent demand for them can be required for sustainable rallies.
BTC Price
At the time of writing, Bitcoin is trading at around $70,200, up more than 4% over the past week.
(Click on image to enlarge)
More By This Author:
Robinhood Acquisition Of Bitstamp Sparks Optimism About The Listing Of XRPADA Down Despite Cardano’s Launch Of Ogmios V6.4.0 Upgrade
Bitcoin ETF Inflows Hit $1.4 Billion Amid Record 17-Day Streak

Comments
Log in or sign up to join the conversation.