
Be Prepared For Whipsaw Trading

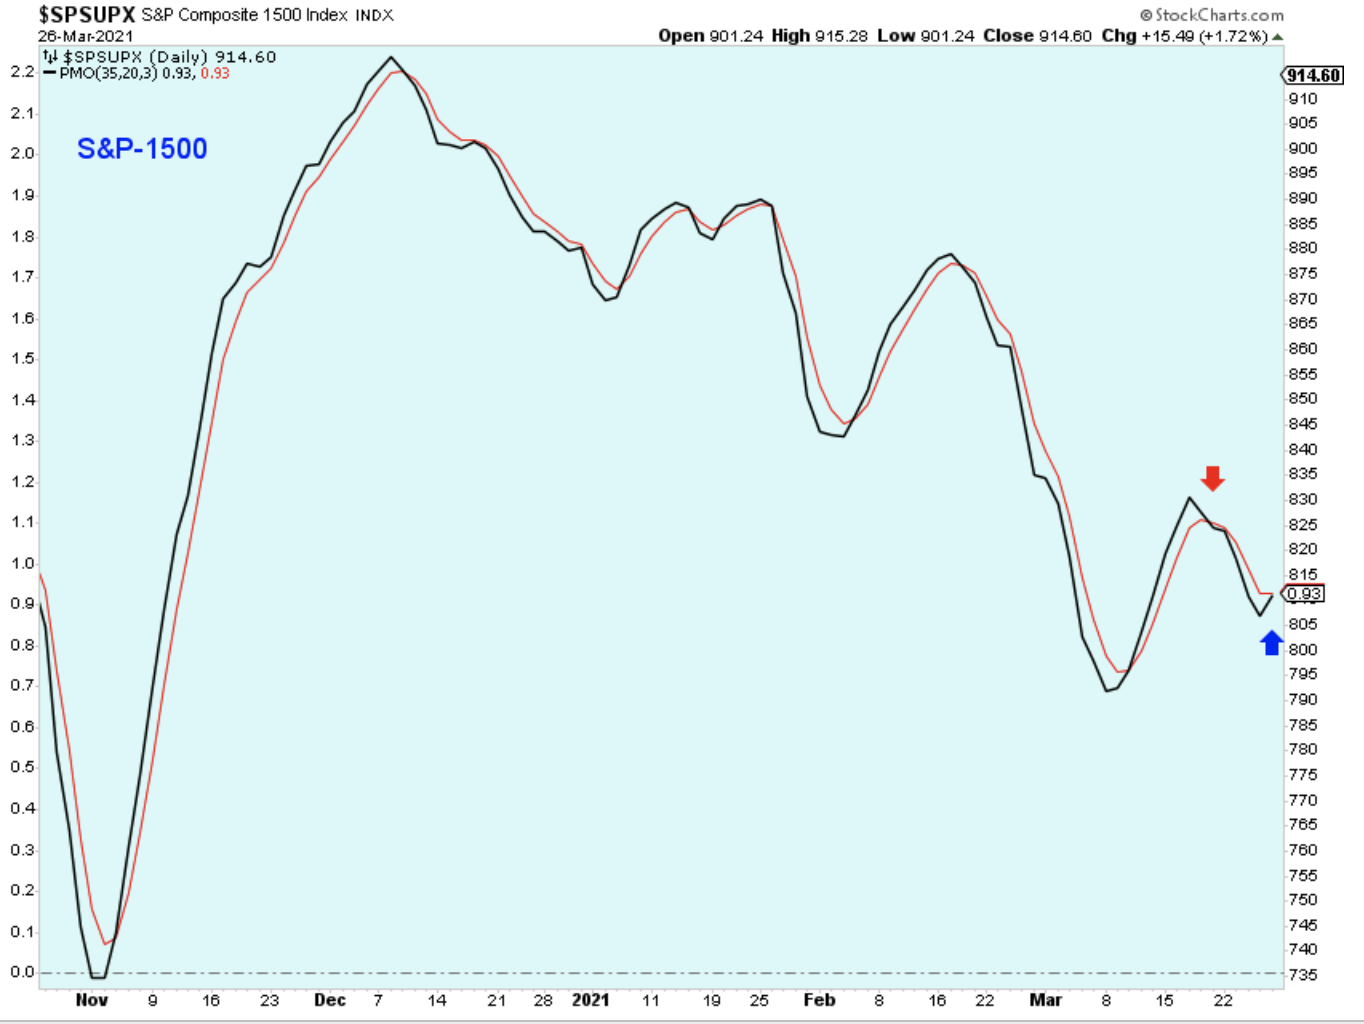
A short-term uptrend started on Friday, March 26. Not all the indicators agree that the trend is higher, and, as a result, we need to be prepared for the possibility of a whipsaw bad-signal. For instance, the PMO index below doesn't show a white candle yet which means that the uptrend is not confirmed. But the charts below show some very bullish-looking patterns, so, in the short-term, the trend is higher.
My trading account had gone to 100% cash a couple weeks ago, but it is now fully invested again. If the market doesn't cooperate next week, I'm prepared to admit my mistake and move back to cash. I'm not going to be stubborn and fight the market.

The SPX ended the day above its 5-day average and had a strong close. The SPX certainly looks bullish based on this chart. The Nasdaq also had a strong day but is lagging and isn't quite above its 5-day. The market is much stronger when all the major indexes participate, so we are trading the market knowing that a lagging Nasdaq isn't ideal.

The PMO indicator for the broader market index has started to turn higher, and from a level that is higher than the previous PMO low. That is generally a good sign but let's see this PMO exceed the high marked by the red arrow. If the PMO can't exceed this level then we need to be prepared for the possibility that it won't find significant support until it reaches the November low.
The SPX summation has turned higher nicely, but it would be more convincing if it had turned higher from a much lower level.

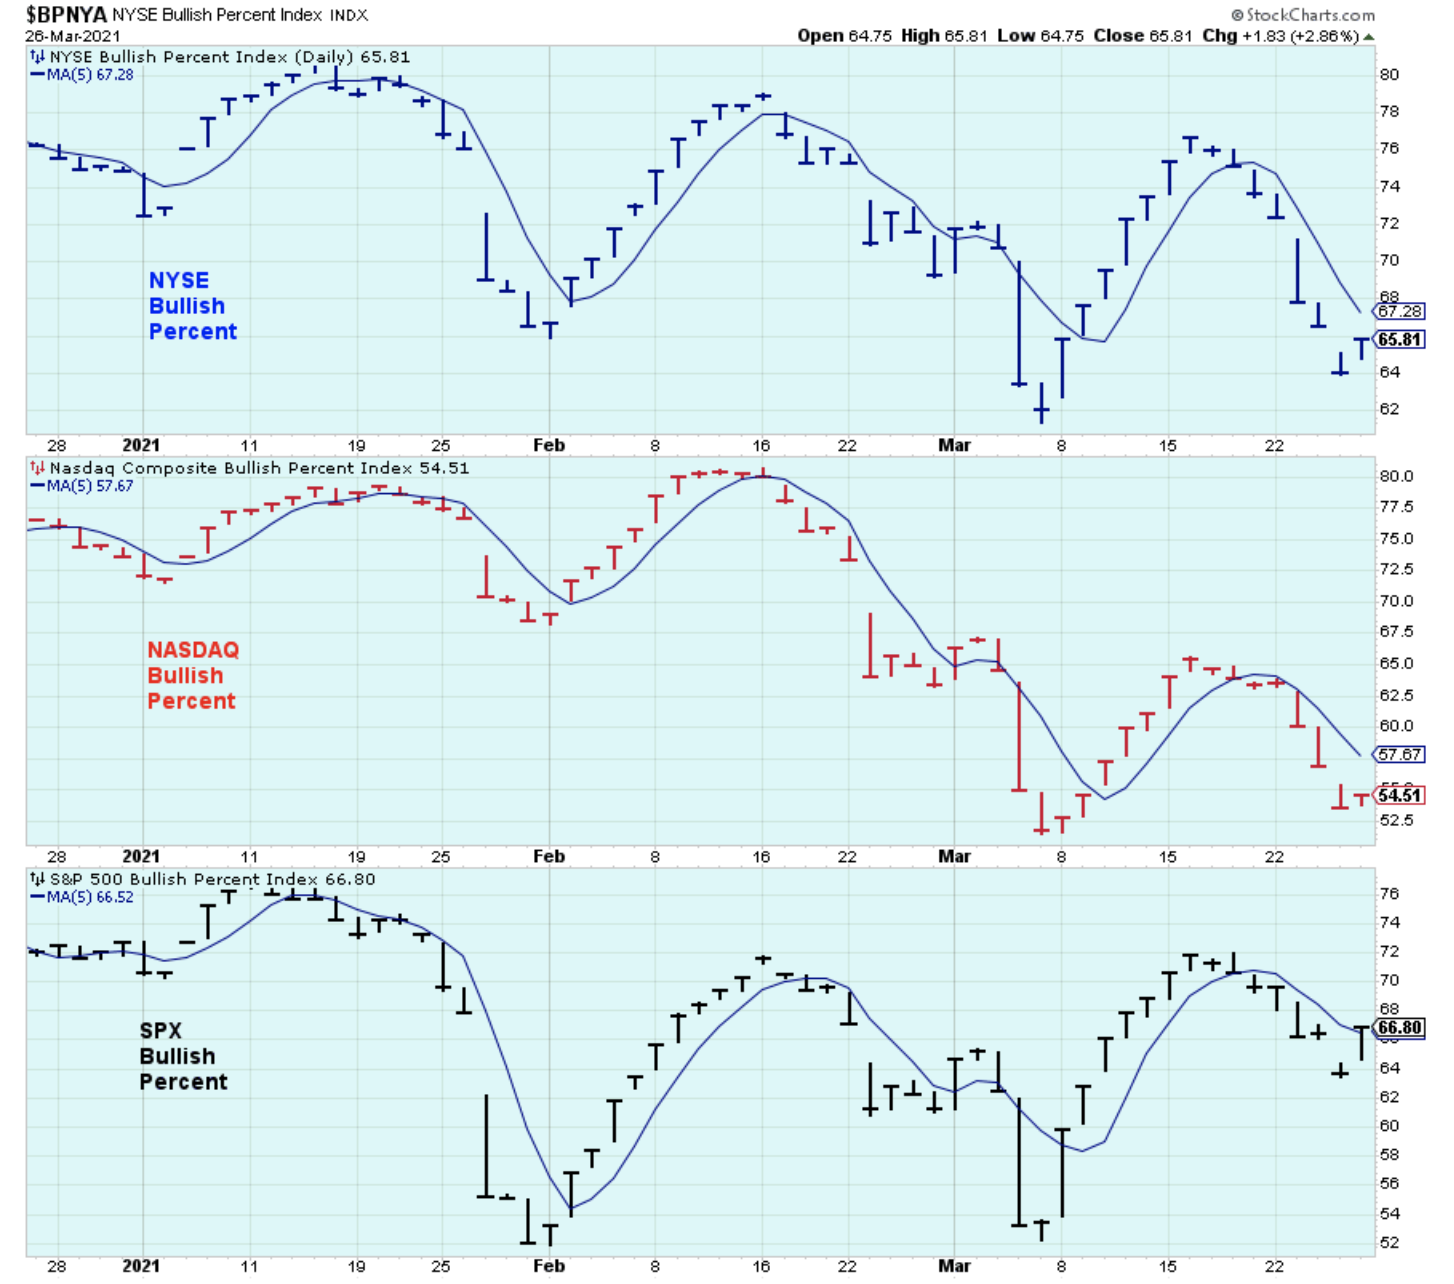
Bullish percents reversed higher but are still below the moving averages.
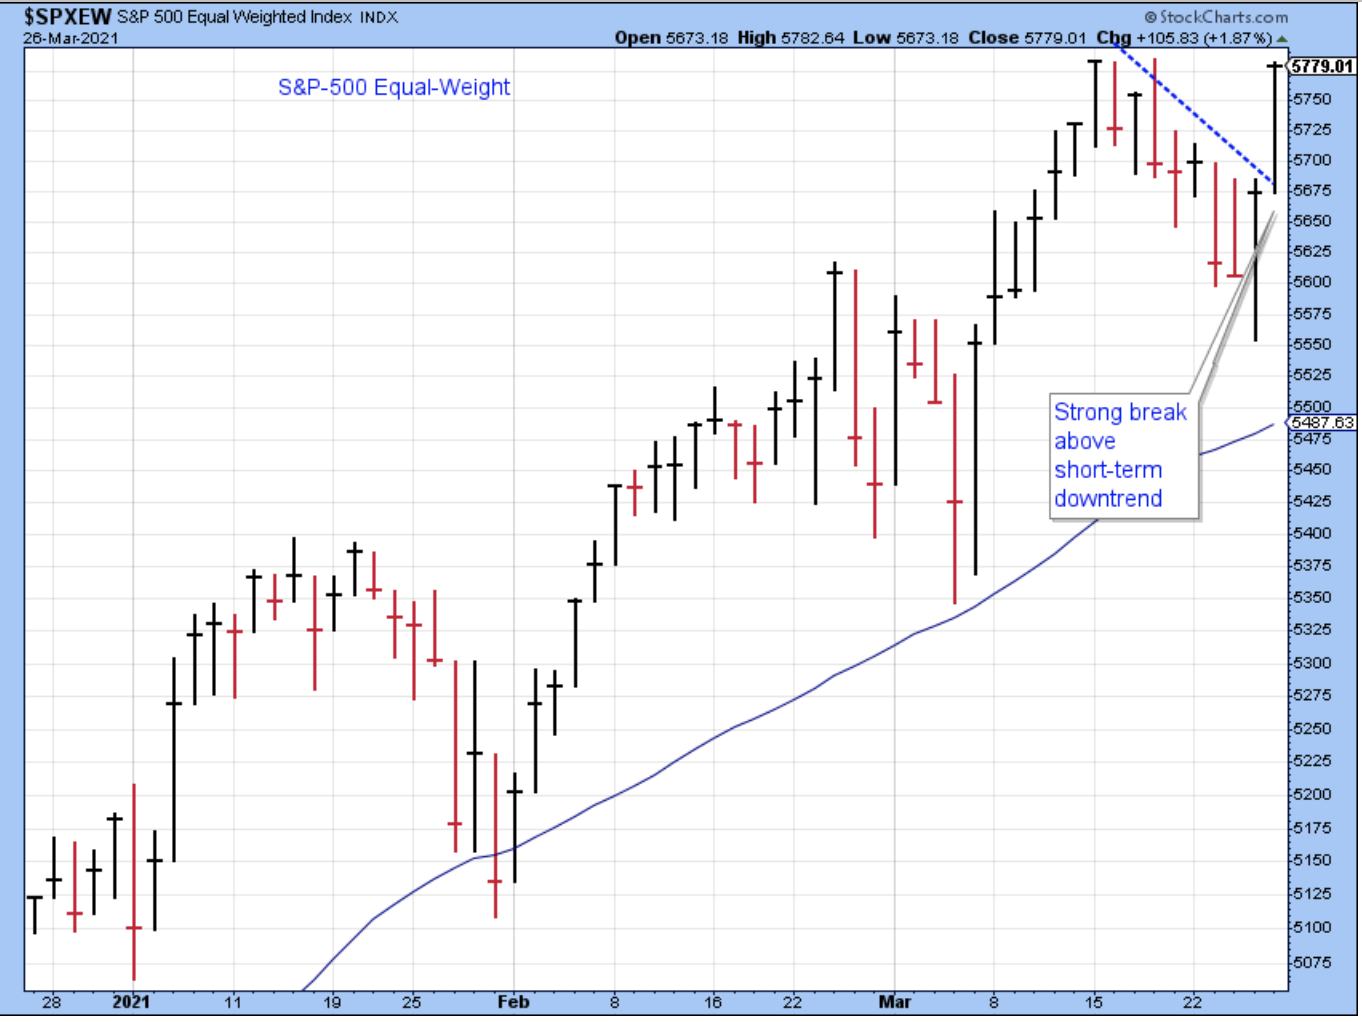
The SPX equal-weight had a convincing break out above the downtrend. It would be difficult to claim that the market is trending lower with a chart like this one, but we've all seen breakouts like this fail at times, so I'm prepared for the possibility.
Small caps have been important leaders since last November, so they were due for some choppiness after a run like this. I like the looks of this chart because the index tested the 50-day and the early March low, then reversed bullishly. We could have had better volume, though. Keep an eye on these small caps to see how the index handles resistance at the 20-day and then the prior highs. The best outcome would be to see it get above the 20-day and stay there for a bit before breaking into new highs. On the other hand, the worst outcome would be a close below Thursday's low which would probably be a signal to move back to cash.

The Semiconductors have held their longer-term uptrend and they bounced back nicely on Friday with strong volume.

Transports showing a very bullish chart.

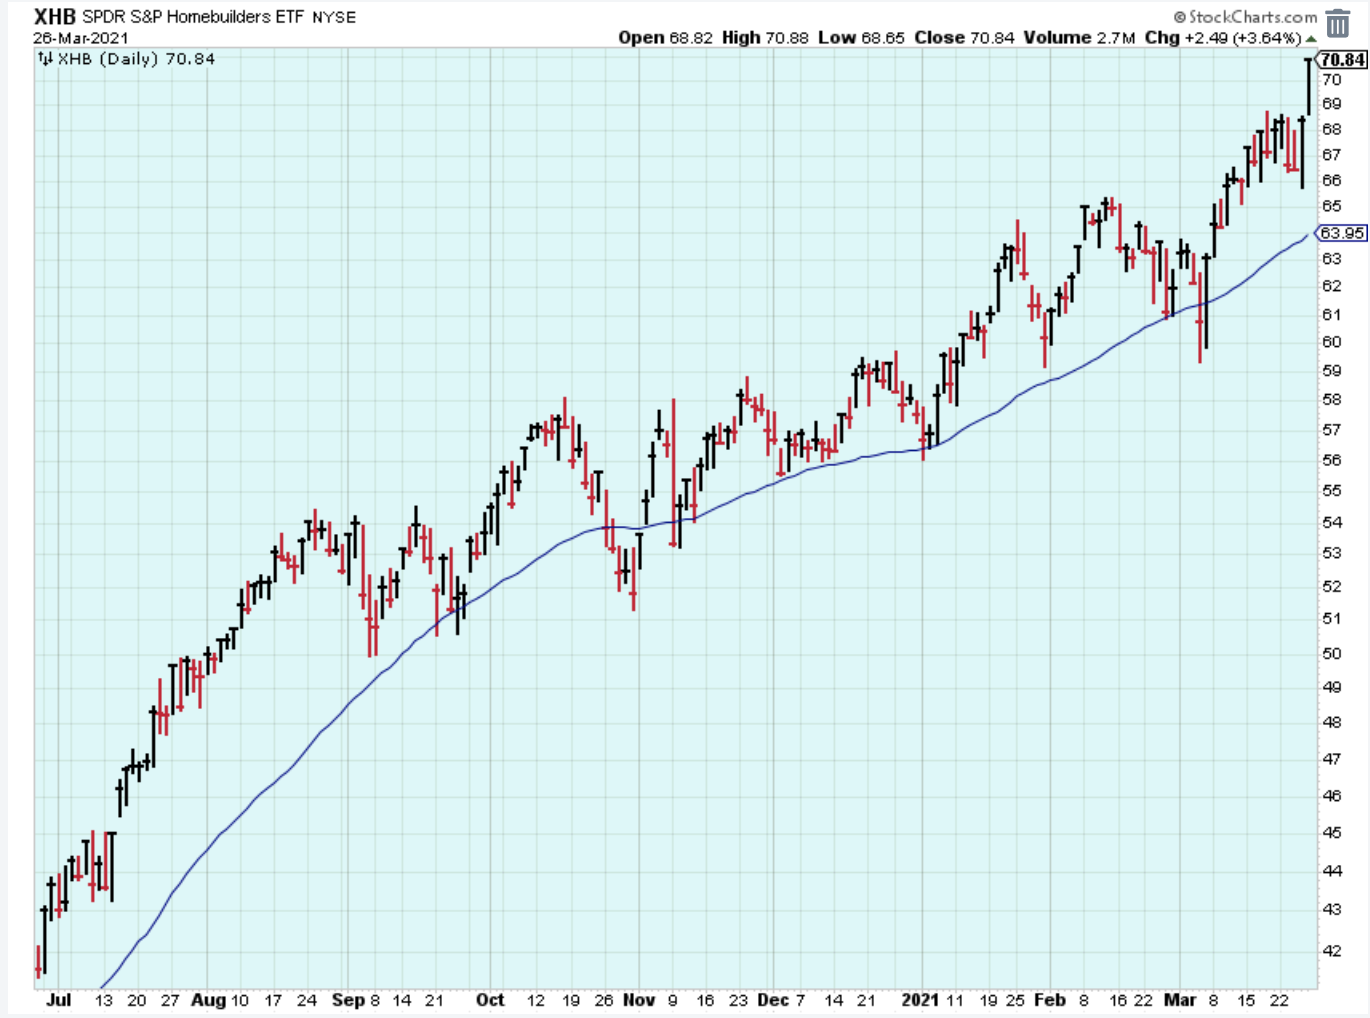
Stocks related to home building and home improvement did really well on Friday. A nice uptrend in this chart.
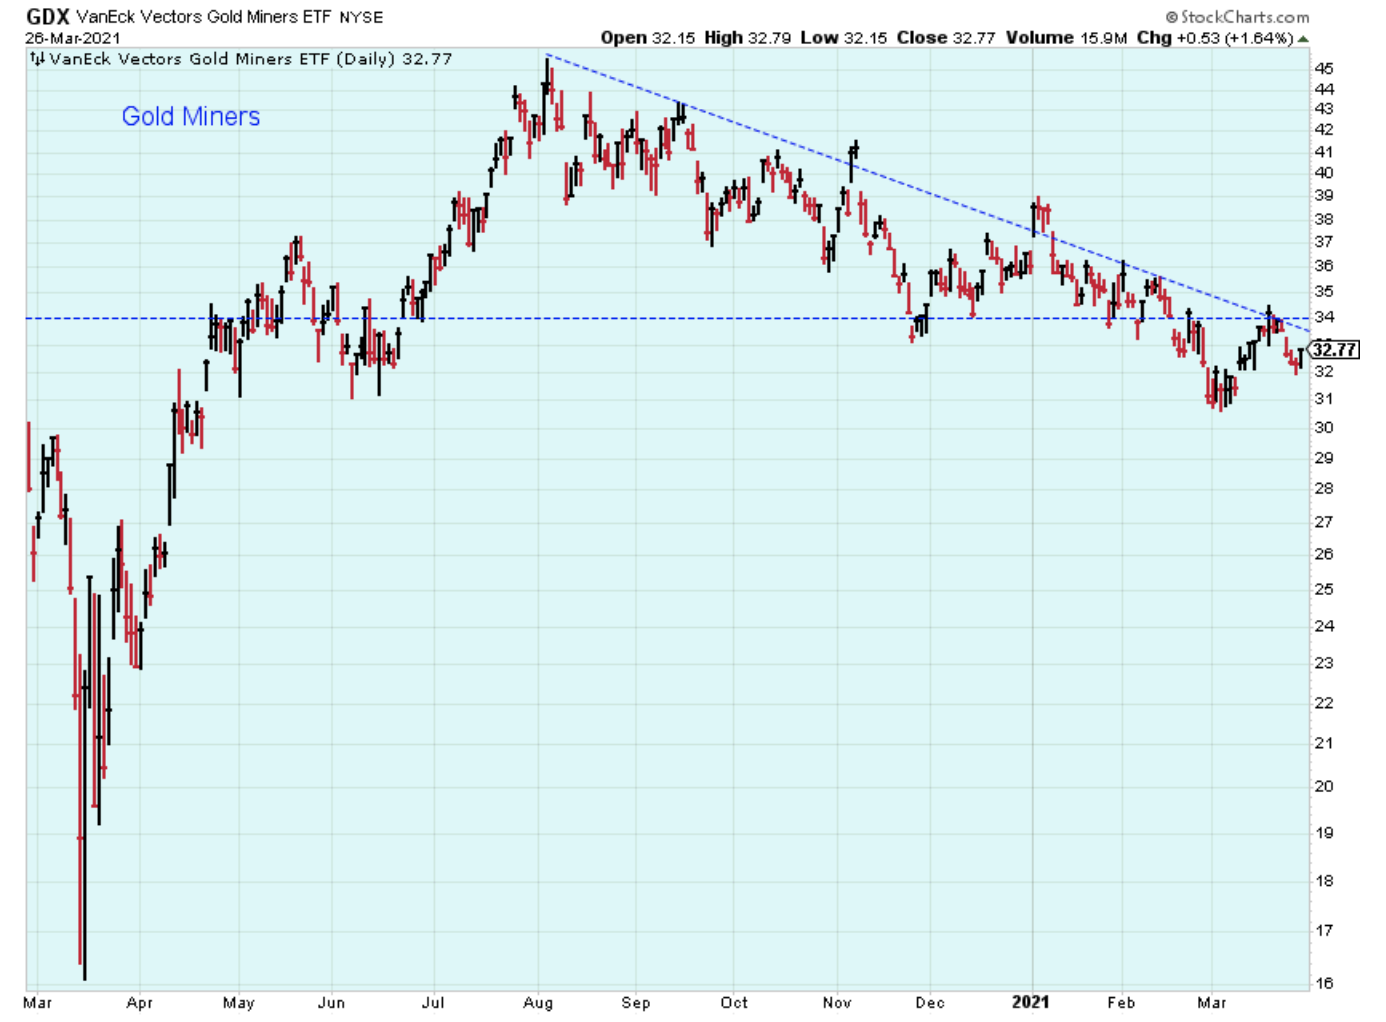
I am watching and waiting for the gold miners to show life. This group could have a strong move if it breaks above the downtrend.
I feel fairly confident that I know what to do with my shorter-term trading account based on these charts. We all know what is going on here regarding the rotation from the stocks that were doing well into the stocks that weren't. So, in the short-term, we stay flexible and adjust our accounts based on the rotation.
But what to do with our longer-term accounts? I'm not at all sure what to do. Many of the value stocks have already run up too far already. My long-term, large-cap account is still 50% cash because I'm not sure where to put the money if I'm planning to buy and hold for longer than a year.
Over the last few years, my favorite spot for the longer-term has been this ETF shown below, but it looks so extended now. Unfortunately, I think the answer is that we need another significant correction before committing the cash longer-term. For now, I'm more focused on the long-term sell signals for this ETF than I am on the long-term buy signals

Outlook Summary


The short-term trend is up for stock prices as of March 25.
Contrarian sentiment is unfavorable for stock prices as of Nov. 14.
The economy is in expansion as of Sept.19.
The medium-term trend for treasury bonds is down as of Oct. 10 (prices lower, yields higher).
Disclaimer: I am not a registered investment adviser. My comments reflect my view of the market, and what I am doing with my accounts. The analysis is not a recommendation to buy, sell, ...
more

