Adani Enterprises Ltd. Indian Stocks Elliott Wave Technical Analysis
ADANI ENTERPRISES LTD – ADANIENT (1D Chart) Elliott Wave Technical Analysis
Function: Counter Trend (Minor degree, Grey)
Mode: Corrective
Structure: Flat (3-3-5)
Position: Minute Wave ((iii)) Navy
Details: Minute Waves ((i)) and ((ii)) Navy of Wave C Grey are in place and Wave ((iii)) is underway now. Ideally, prices should stay below 3200.
Invalidation point: 3750
(Click on image to enlarge)
ADANI ENTERPRISES Daily Chart Technical Analysis and potential Elliott Wave Counts:
ADANI ENTERPRISES daily chart indicates a potential trend reversal after hitting 4170-80 range in December 2022. The stock might have terminated Intermediate Wave (5) Orange as marked and is now progressing to carve a Minor degree corrective wave A-B-C.
The stock has terminated Minor Wave A around 1020 mark in February 2023, which was followed by a corrective rally Minute ((a))-((b))-((c)) to terminate Minor Wave B Grey, around the 3740-50 range. Since then, bears have remained in control as they unfold Minor Wave C lower.
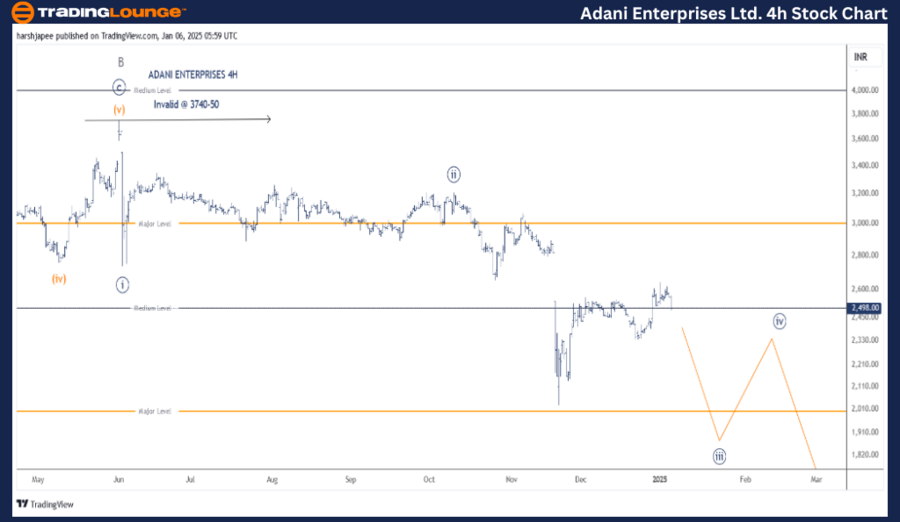
ADANI ENTERPRISES LTD – ADANIENT (4H Chart) Elliott Wave Technical Analysis
Function: Counter Trend (Minor degree, Grey)
Mode: Corrective
Structure: Flat (3-3-5)
Position: Minute Wave ((iii)) Navy
Details: Minute Waves ((i)) and ((ii)) Navy of Wave C Grey are in place and Wave ((iii)) is underway now. It is quite possible that Minute wave ((iii)) is extending. Ideally, prices should stay below 3200.
Invalidation point: 3750
(Click on image to enlarge)
ADANI ENTERPRISES 4H Chart Technical Analysis and potential Elliott Wave Counts:
ADANI ENTERPRISES 4H chart is highlighting the sub waves after Minor Wave B terminated around 3740-50 range. As it is normal for Wave C to unfold as an impulse, we have marked Minute Waves ((i)) and ((ii)) potentially complete around 2754 and 3214 levels respectively.
Further, Minute Wave ((iii)) could be unfolding now as a potential extension towards 1650 levels going forward. For the above to hold, prices should stay below the 3200 mark.
Conclusion:
ADANI ENTERPRISES is progressing lower within Minute Wave ((iii)) of Minor Wave C towards 1650 mark.
More By This Author:
Dogecoin Crypto Price News Today Elliott Wave Technical Analysis 9
Unlocking ASX Trading Success: Car Group Limited
Elliott Wave Technical Analysis - Advanced Micro Devices Inc.
Analyst Peter Mathers TradingLounge™ Australian Financial Services Licence - AFSL 317817

.thumb.png.01be679a116766e7f712bf41dbe28531.png)


