
It’s that time again*: we have reached the stage in the business cycle when normally sensible economists are alarmed that the Beveridge curve has shifted up. Paul Krugman is (as usual) on the side of relative reason, but he miss-used the curve in this figure
(Click on image to enlarge)
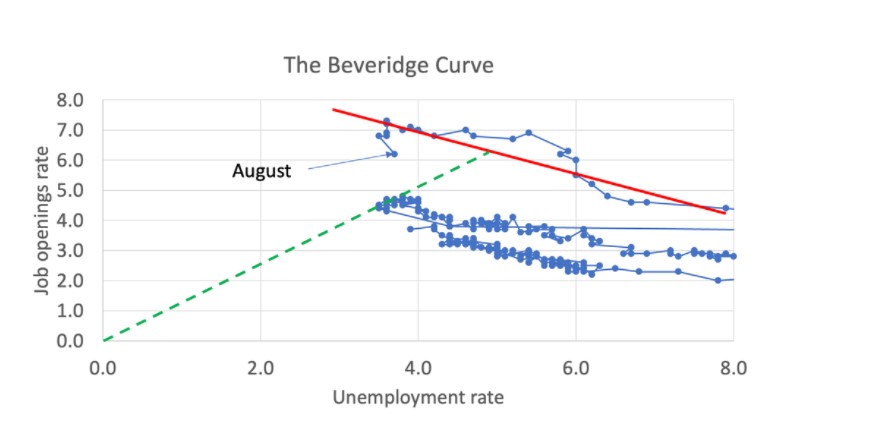
Here he uses the data *and* the assumption that there is a stable Beveridge curve which can be used for medium term forecasting to calculate a level of unemployment consistent with a normal ratio of vacancies to unemployment *assuming* that future observations are on or near the line drawn through recent observations. I suspect that he is succumbing to the iresistable temptation to be an accidental theorist (TM P Krugman).
I will now quote what I wrote on the topic on
“might imagine that high unemployment and high vacancy rates are, as you directly state, a bad sign as high unemployment combined with high vacancies lasts longer — that the combination is a sign of hysteresis from a) deteriorated jobs skills, or b)deteriorated work habits, or c) irrational stigma due to employers assuming a or be or d) mismatch.
I recall such a graph. It was the terrifying UK Beveridge curve from 1988-9 (look it up). The word (from among others Layard) was that unemployment had become almost impossible to fight as the long term unemployed were discouraged. Then employment took off.
The Beveridge curve is the lower envelope of a slightly more complicated dynamic with counterclockwise cycles above the curve. That’s a fancy way to say it takes a while after a labor demand trough to get the unemployed into the vacant jobs. You see a smaller shift in the matching function (hires as function of vacancies and unemployed). In the UK very late 80s you saw a shift in the matching function too.
That was just before the UK ceased to be an example of the European unemployment problem and became an example of well-functioning labor markets in English-speaking countries.
Krugman shares your [Brad DeLong’s] view and he does tend to be right, but still, I’m tempted to make a prediction.” See also.
Now let's see how my prediction held up Krugman came around to my view. The data followed
Fairly soon people asked how unemployment could be so persistently low not stubbornly high (then Covid 19 hit and we went for another typical cycle: Shock, recession, recovery, economists worried about the Beveridge curve, economists surprised by low unemplyment and moderate inflation.
I suppose I should do some work and find a Beveridge alarm stage of every business cycle (I know the Clinton Treasury was so alarmed in 1993). But I am lazy.
*well technically it is a week after that time because I am very very lazy.
More By This Author:
Are You Better Off Now Than During The 2008 Recession?
World Crop Quick Update
Review: "The Future Is History"

Comments
Log in or sign up to join the conversation.