
Can Stocks Get Over The Hump This Time?
Stocks Have Stalled In This Area Previously
The recent push off the Fed meeting low has brought equities back to a familiar area. The chart of the S&P 500 below shows the upper blue line has acted as resistance three times in the last six months (see orange arrows).

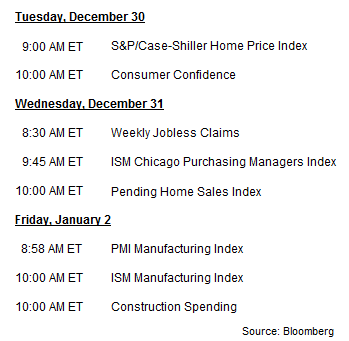
Reaction To Economic Data
Investors’ reaction to this week’s economic data will most likely determine the market’s short-term fate:
Tech, Industrials Side With Bullish Odds
This week’s stock market video shows numerous areas of potential resistance, along with recent positive developments in the technology and industrial sectors.
Video Length: 00:09:25
Investment Implications – The Weight Of The Evidence
While the market’s appetite for risk has improved significantly in the wake of the last Fed statement, the economic and stock market bulls still have some work to do. The evidence we have in hand aligns with an equity-friendly investment stance. However, the market’s recent bipolar nature calls for flexibility until the bulls can take out overhead resistance.
Disclosure: This post contains the current opinions of the author but not necessarily those of Ciovacco Capital Management. The opinions are subject to ...
more

