


Sometimes the daily chart only tells part of the story.
Following your feedback under our previous Lab Note (thank you for that!), today we're zooming out. Alongside our regular daily analysis, we're also looking at the weekly charts to better understand where the market could be heading over the coming days.
Let's see what the bigger picture is telling us.
Dollar (DX.F)
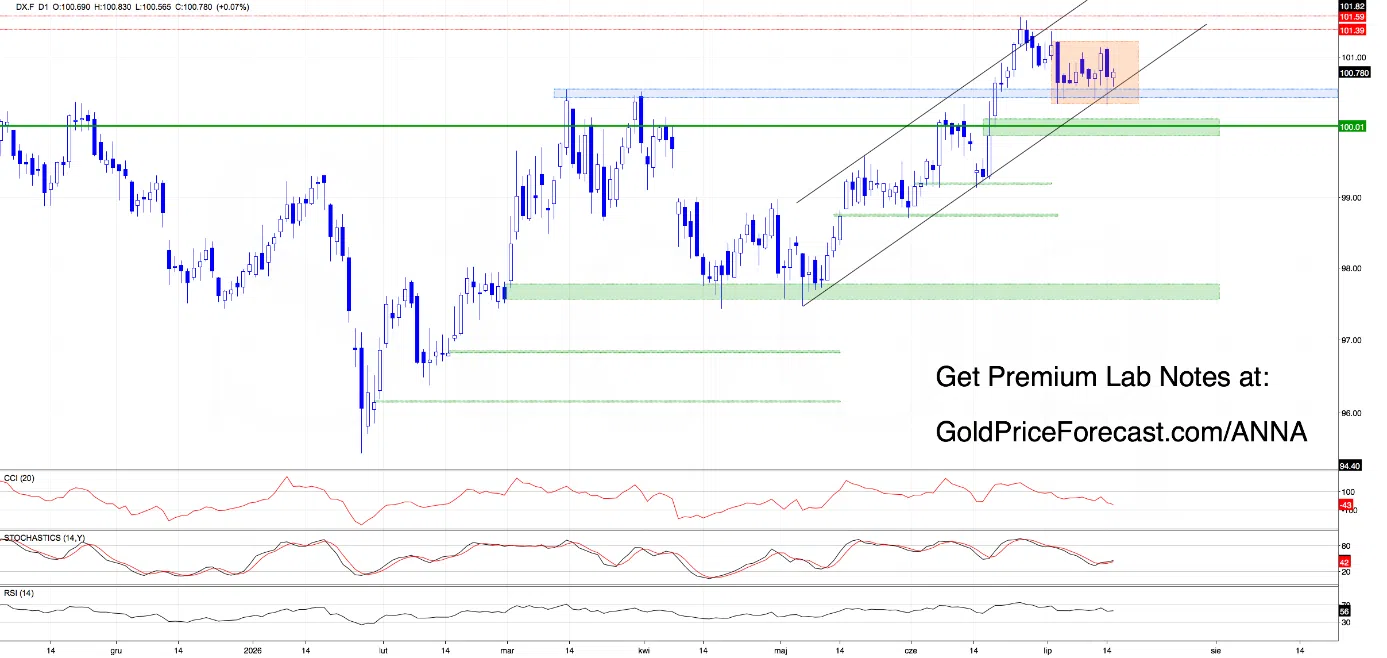
Looking at the daily chart, three things stand out.
First, the consolidation remains intact, keeping the dollar locked inside a relatively tight trading range.
Second, both sides scored a technical point last week. Buyers successfully defended the key support zone, while sellers printed a bearish engulfing pattern, reinforcing resistance overhead.
And finally, the key support and resistance levels we've been tracking remain unchanged, meaning the scenarios discussed in previous Labs are still fully valid.
Today, however, we're zooming out to the weekly chart.
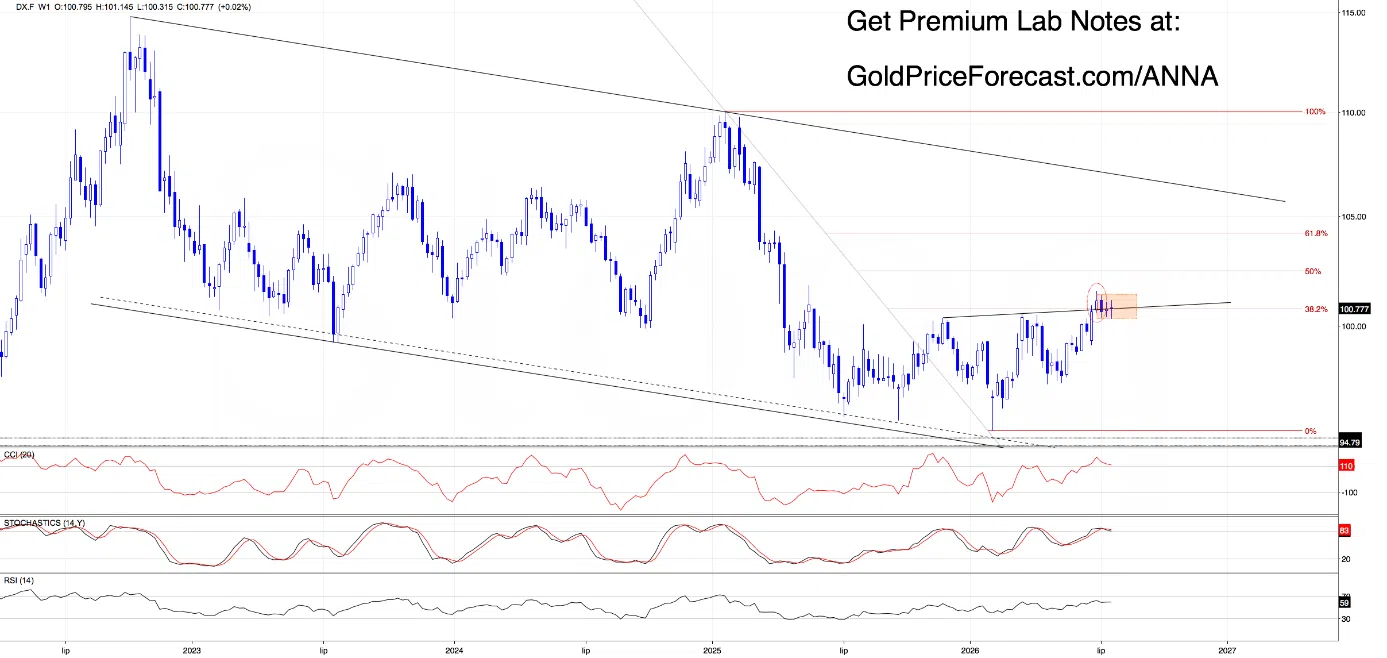
From this perspective, the dollar is sitting at an extremely important technical crossroads. This isn't just a battle over the current consolidation - it's also a fight to defend the black support/resistance line (based on the previous swing highs) and the 38.2% Fibonacci retracement.
If buyers regain control, the next upside targets from the daily chart remain valid, with an additional technical target near the 50% Fibonacci retracement around 102.50.
If sellers win this battle, the first downside targets remain the same as discussed previously. However, considering the weekly chart, the minimum downside projection based on the consolidation's height points toward roughly 99.23, where the market could also test the bullish engulfing formation created back in June.
Takeaway
Watch the 100.36-100.53 support zone together with 100.32.
Daily close below it -> increases downside risk and opens the door toward 99.86-100.15.
Hold above support -> current consolidation remains intact.
Break above 101.21 -> keep the short-term uptrend alive.
Palladium (PA.F)
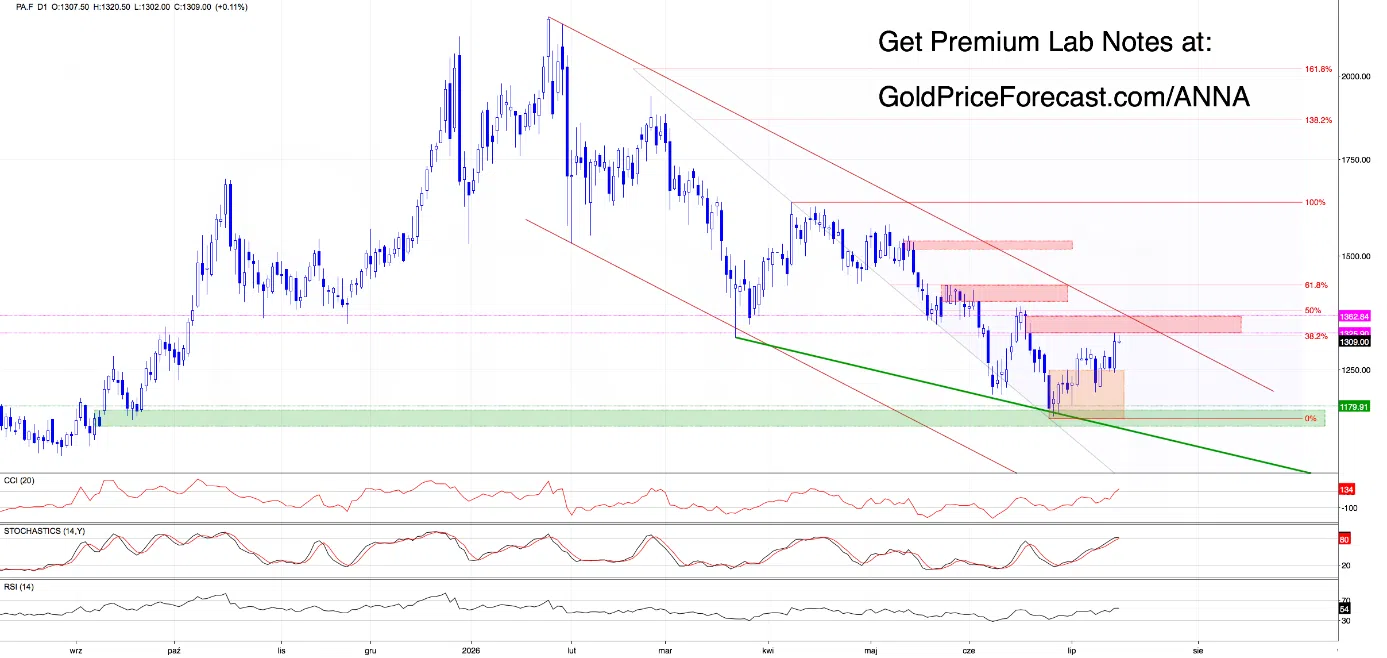
Buyers once again delivered exactly what they needed.
After successfully defending the previously broken upper boundary of the consolidation around 1248, palladium closed Monday's bearish gap and continued its move toward the next upside target discussed in Thursday’s Lab (1324-1363).
Price has now reached a strong resistance zone reinforced by the upper boundary of the green rising channel, suggesting caution despite the recent strength.
The weekly chart remains constructive.
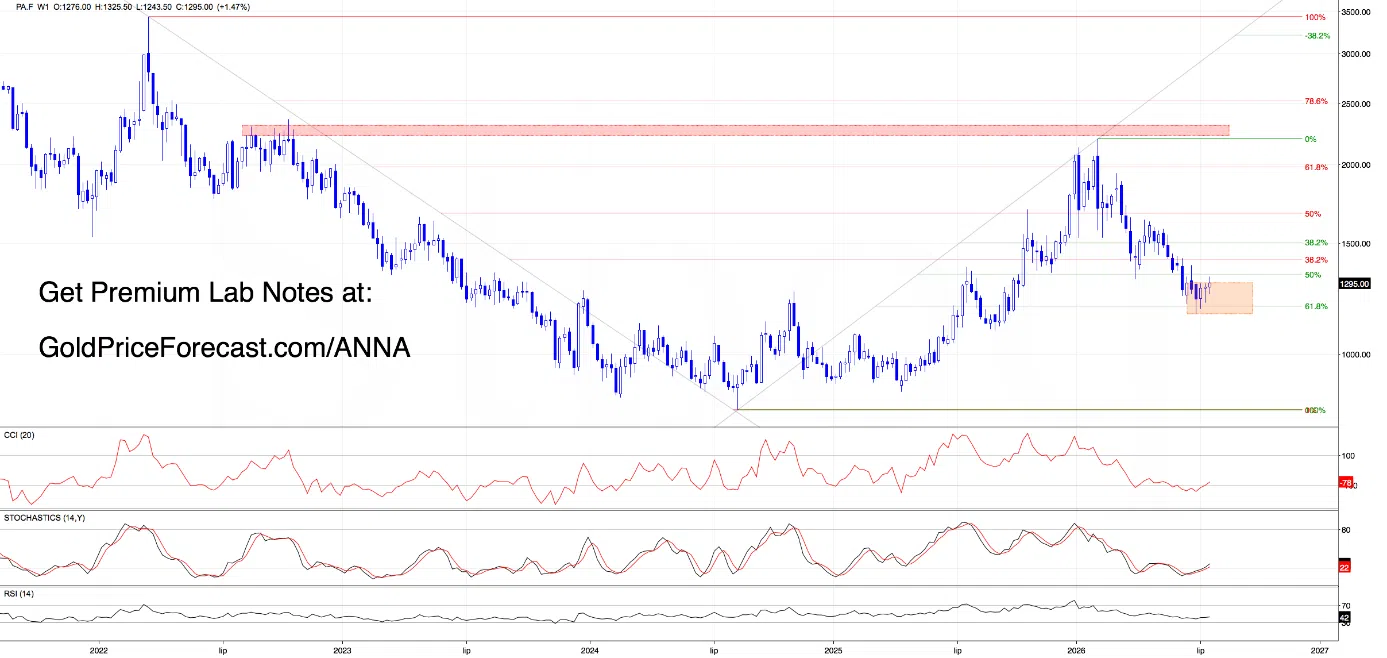
Palladium has not only left its multi-week consolidation behind, but momentum indicators continue to generate buy signals. That said, we'd become much more confident in the bullish scenario if buyers can secure a weekly close above 1296.50.
Takeaway
Watch 1296.50 & 1324-1363 resistance area.
Weekly close above 1296.50 -> strengthens the bullish continuation.
Failure there -> expect sellers to challenge 1250 first.
Copper (HG.F)
Let's begin with a quick reminder from Thursday:
“(…) Momentum has clearly improved.
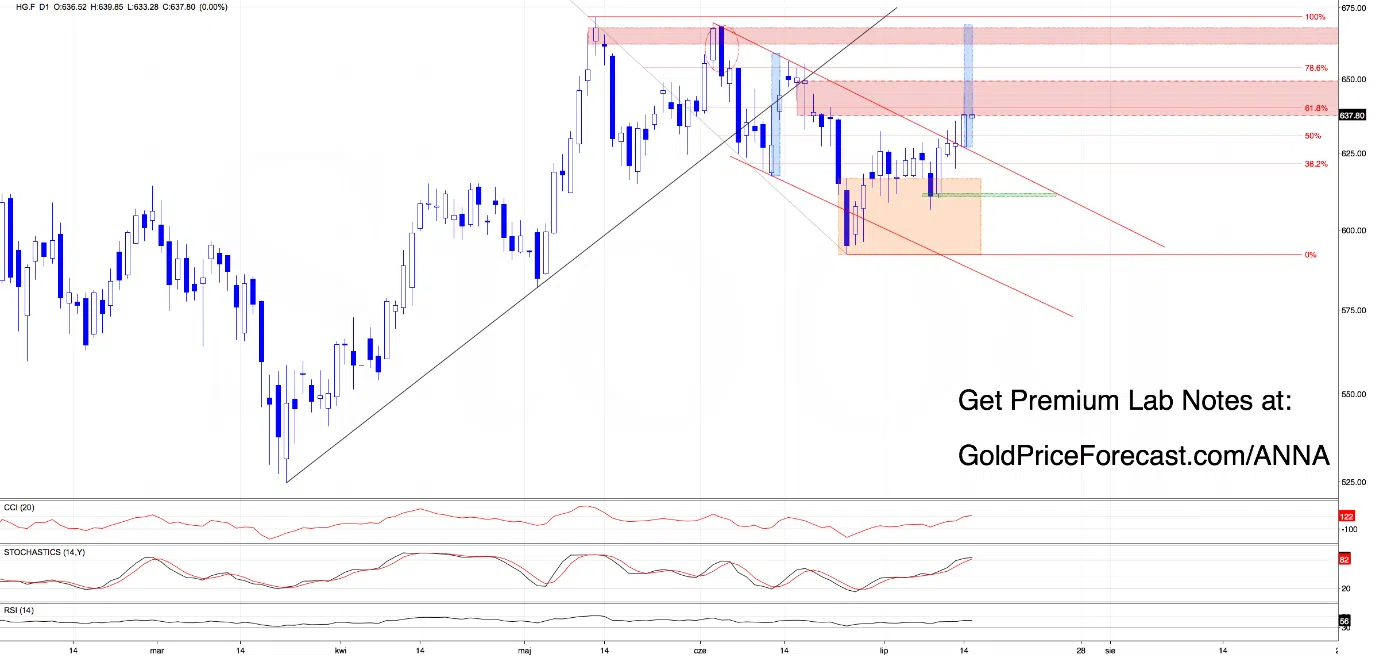
Now attention shifts toward the upper boundary of the red descending channel, currently sitting near 634.78. That level is likely to determine whether this recovery has enough fuel to continue. (…)”
So far, the market has followed that scenario as expected.
Buyers managed to reclaim the upper boundary of the red declining channel, opening the door toward this year's highs.
The only major obstacle left is the large bearish gap between 637.25-649.35, especially around 650, where several technical factors now overlap.
On the H4 chart, that resistance becomes even more significant.
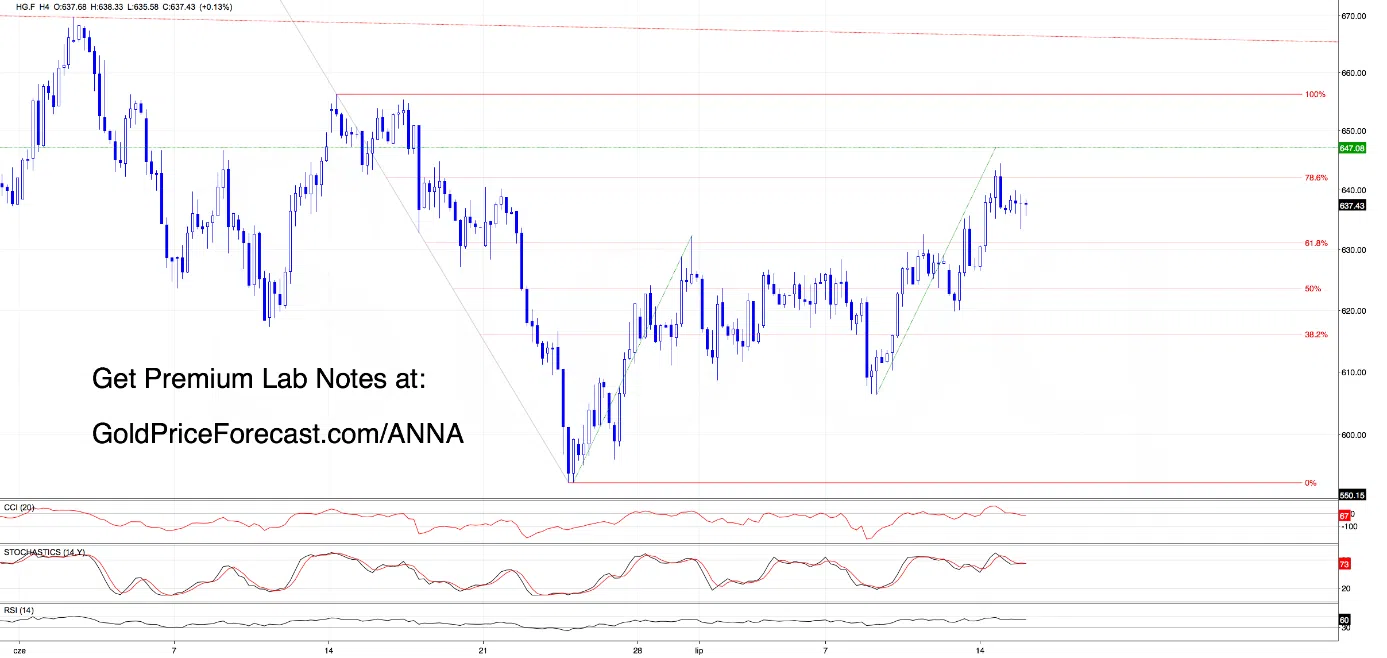
Not only does the upper boundary of the gap sit there, but the measured move of the current ABCD pattern also completes in the same area. At the same time, H4 indicators are heavily overbought and beginning to show bearish divergence, suggesting that buyers may need a pause before attempting another leg higher.
Nevertheless, the weekly chart remains encouraging.
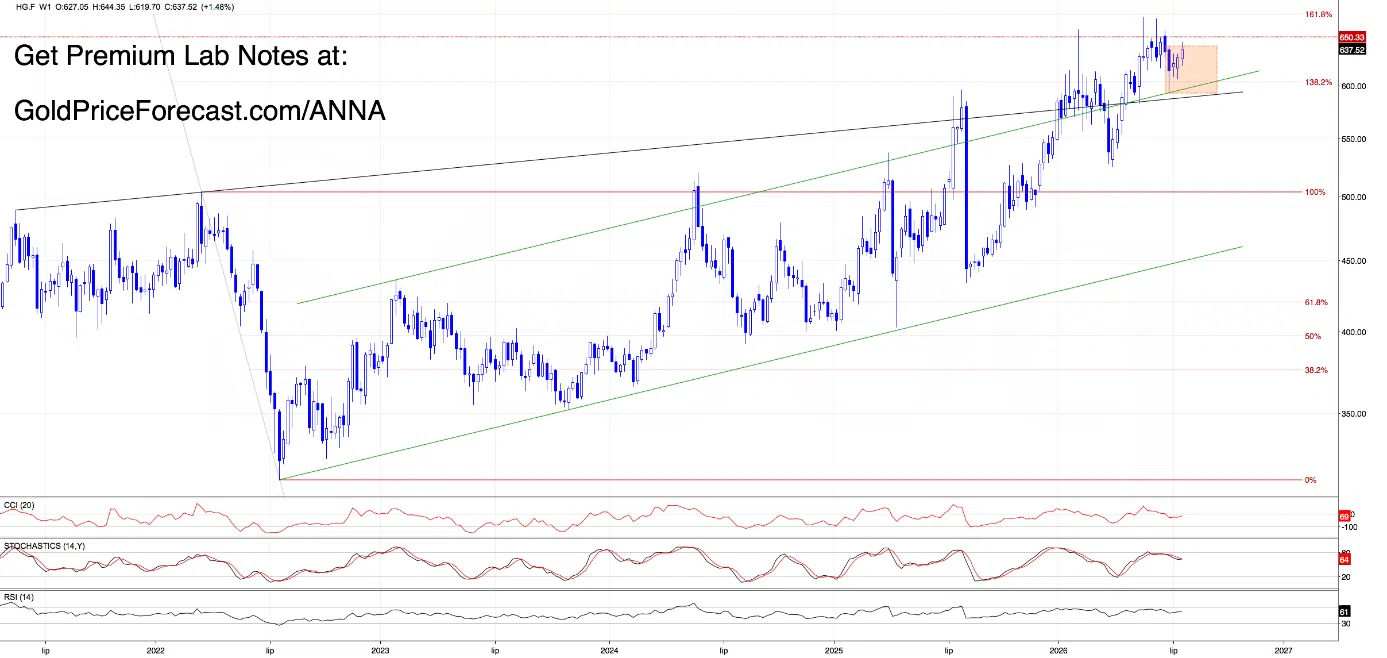
Copper has reclaimed the upper boundary of the green rising channel and now trades above the upper boundary of the orange consolidation, significantly improving the longer-term technical picture.
However, taking all the above into account, a weekly close above 640.35 would strengthen the bullish case, opening the door toward 675.43 (161.8% Fibonacci extension) and potentially the 692-700 zone.
Takeaway
Watch 637.25-649.35 // 640.35 and the 650 resistance zone.
Weekly close above 640.35 -> strengthens the path toward 675.43.
Failure near 650 -> expect a healthy pullback before buyers attempt another advance.
A Small Personal Milestone
Today's edition is Lab Note #200.
When I wrote the first one, I simply wanted to share the way I look at the markets. Two hundred Lab Notes later, that hasn't changed.
Thank you for reading, for thinking alongside me, and for making this journey worth continuing.
Whether this is your very first Lab or your two-hundredth... I'm glad you're here.
See you in Lab Note #201.
Stay calm, trust the process, and let the levels do the work.



Comments
Log in or sign up to join the conversation.