

Image Source: Nicholas Cappello on Unsplash
The S&P 500 is up roughly a thousand points over the last year. So how is it possible to have bought and held through all that and still lose money? One word: inflation. And there’s an easy way to understand this I want to show you today.
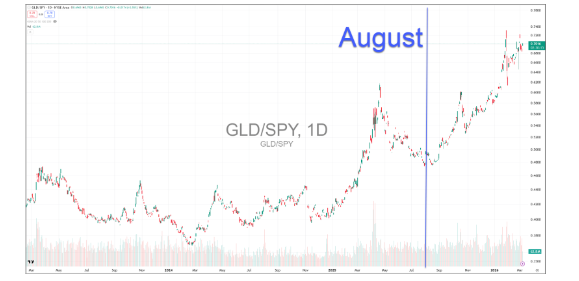
You see, measured against gold, the S&P 500 has lost 33% of its purchasing power since August. The index has gone sideways in price while gold has ripped higher, and the gap between the two tells you what the nominal price chart does not. A weakening dollar inflates the number on your screen. It creates the appearance of gains that do not exist in real terms.
In fact, our Ghost Prints console has been flagging institutional call buying in the GLD ETF for weeks. Gold was up 1.4% on Friday, while the S&P 500 sold off 75 points. The flow confirms what the ratio already showed.
The SPY/GLD ratio measures the real value of the market. And it’s the key to understanding whether you’re actually making money.
Why the Nominal Price Lies to You
The S&P 500 was trading at around 5,700 a year ago. It sits near 6,700 today. On the surface, that looks like a gain of roughly a thousand points. The chart makes higher lows, and the financial media calls it a bull market.
The SPY/GLD ratio tells a different story. A year ago, the ratio sat at approximately 1.95. Today, it has fallen to approximately 1.31.
The math is straightforward. The decline of 0.66 divided by the starting value of 1.95 equals a 33% loss in purchasing power relative to gold. The S&P 500 went up in price, but it went down in value. That changed in August.
The Fed shifted to rate-cutting mode at Jackson Hole. They acknowledged rising unemployment risks and signaled that lower rates were coming. That pivot weakened the dollar. A weaker dollar inflates the nominal price of equities because it takes more dollars to buy the same assets.
Gold responds to that same dynamic in the opposite direction. When the dollar weakens, gold strengthens because gold is priced in dollars globally. The result is a ratio that collapses even as the index price grinds sideways or higher.
Why This Means It Is Not a Bull Market
A bull market requires more than rising prices. It requires rising value.
If the S&P 500 gains 15% in nominal terms but the dollar loses 20% of its purchasing power, you are poorer in real terms. The chart looks healthy. Your portfolio buys less.
The S&P 500 has not outperformed gold over the last 30 years. That is a structural statement about the relationship between equities and hard assets over long periods.
On the shorter timeframe since August, the underperformance has been extreme. A 33% decline in relative value in under a year is not what a bull market looks like regardless of what the nominal chart shows.
The Risk Most Traders Are Ignoring
The current environment works as long as the dollar stays weak. A weak dollar keeps gold elevated and keeps the nominal S&P 500 propped up through currency effects. The risk is that the dollar could start to strengthen.
If the dollar reverses higher, two things happen simultaneously. Gold pulls back, and the nominal gains in equities that were driven by dollar weakness evaporate.
The S&P 500 could find itself back at 5,000 without anything changing fundamentally about the companies inside the index. The price was inflated by currency, and a stronger dollar would deflate it.
This week's negative jobs report adds another layer. Weaker employment data could push the Fed further into cutting mode, which would weaken the dollar and extend the dynamic.
If inflation re-accelerates from geopolitical risk and the Fed pauses, the dollar would strengthens and equities would give back the mirage.
What the Console Is Tracking Now
Our console has been catching institutional gold flow consistently over the past several weeks. Call buying in GLD has appeared in size across multiple sessions. That positioning is the institutional response to the same dynamic the ratio measures.
Institutions are not betting on equity breakouts. They are moving capital into the asset that benefits from dollar weakness.
The SPY/GLD ratio on a four-week rate of change is still declining. The market is going sideways in price, but losing value on every weekly bar. VIX futures are in backwardation, and the VIX3M/VIX ratio sits below 1.0. Those readings suggest the market may find a short-term bottom and rally toward 6,900 or 7,000.
Even if that rally materializes, it does not change the bigger picture. A move to 7,000 in nominal terms still leaves the S&P 500 deep in the red against gold.
The nominal chart gives you a number. The ratio gives you the truth. Until the SPY/GLD ratio reverses its decline, the purchasing power of equity portfolios is shrinking regardless of what the screen shows.


Comments
Log in or sign up to join the conversation.