

Often traders feel they’re on top of the world with positions but then things can change just they start doing victory laps.
After 40 years in the business this applies to me as well. I remember a time nearly 25 years ago when I learned this lesson well. Then I was long silver futures and it was up a lot as I walked into a meeting which lasted over an hour. While there I was wondering what the new Porsche might cost me while looking around to others there thinking how sharp and brilliant I had become. When I left the meeting silver futures were limit down (sigh). So much for the Porsche and my arrogant ego adjustment was at hand.
Chart no longer available from the original source.
Now I always apply that lesson to trading and do so every trade I make before taking a victory lap or not.
Meanwhile, back at the ranch, um Wall & Broad, stocks had some difficulty Thursday given some bad economic data that finally wasn’t good news. While New Home Sales were strong, but Durable Goods Orders fell sharply to -2.00% vs prior 1.9% and the Chicago Fed Activity Index also fell to -0.41 vs prior 0.51. The latter reading puts it in the same weak category as its peers including: New York, Philly, Richmond, Dallas, and Kansas City.
Market bellwether Caterpillar laid an egg forecasting weakened sales and laying off 10,000 workers. I wonder if they’ll still be buying back shares.
Chart no longer available from the original source.
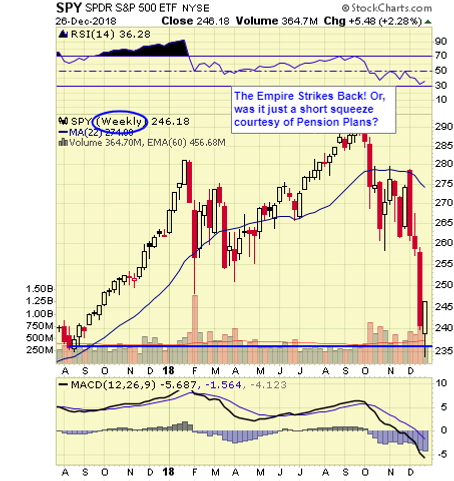
Stocks were quite weak until JP Morgan told its clients to start buying shares and presto, shares rallied sharply off the lows. Maybe the analyst got some bullish advice early from a leak of Janet Yellen’s speech after the close. Nothing would surprise me.
Market sectors moving higher included: Energy (XLE), Regional Banks (KRE), Gold (GLD), Gold Miners (GDX), Crude Oil (USO), Long Treasury’s (TLT), Brazil (EWZ), Australia (EWA), Vietnam (VNM), New Zealand (ENZL), Poland (PLND), Euro (FXE) and a handful of others.
Market sectors moving lower included: Healthcare (XLV), Biotech (IBB), Financials (XLF), Industrials (XLI), REITs (IYR), Materials (XLB), Hedged Europe (HEDJ), Junk Bonds (HYG), Japan (EWJ), Hedged Japan (DXJ), Hong Kong (EWH), China (FXI), Asia ex-Japan (AAXJ), South Korea (EWY), Emerging Markets (EEM), Taiwan (EWT) and many others.
The top ETF daily market movers by percentage change in volume whether rising or falling is available daily.
Volume heavy on two-way action included JPM’s buy stocks note. Breadth per the WSJ was negative as was Money Flow.
Chart no longer available from the original source.
SPY 5 MINUTE
Chart no longer available from the original source.
SPX DAILY
Chart no longer available from the original source.
SPX WEEKLY
Chart no longer available from the original source.
INDU DAILY
Chart no longer available from the original source.
INDU WEEKLY
Chart no longer available from the original source.
RUT WEEKLY
Chart no longer available from the original source.
NDX WEEKLY
Chart no longer available from the original source.
NYMO DAILY
Chart no longer available from the original source.
The NYMO is a market breadth indicator that is based on the difference between the number of advancing and declining issues on the NYSE. When readings are +60/-60 markets are extended short-term.
NYSI DAILY
Chart no longer available from the original source.
The McClellan Summation Index is a long-term version of the McClellan Oscillator. It is a market breadth indicator, and interpretation is similar to that of the McClellan Oscillator, except that it is more suited to major trends. I believe readings of +1000/-1000 reveal markets as much extended.
VIX WEEKLY
Chart no longer available from the original source.
The VIX is a widely used measure of market risk and is often referred to as the "investor fear gauge". Our own interpretation is highlighted in the chart above. The VIX measures the level of put option activity over a 30-day period. Greater buying of put options (protection) causes the index to rise.
This is another short posting since we await Janet Yellen’s next attempt to soothe bulls and markets.


Comments
Log in or sign up to join the conversation.