


Reversing the pattern of declining curves, the curve has steepened since the War’s start.
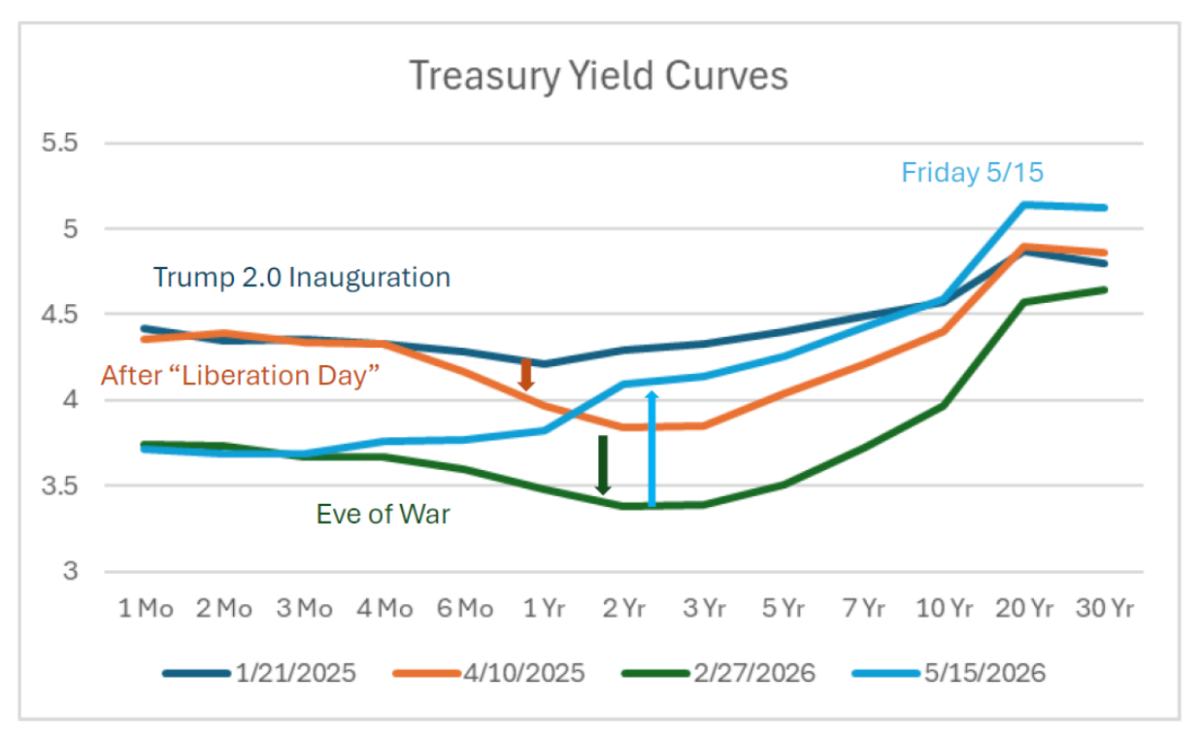
Figure 1: Yield curve as of 1/21/2025 (blue), as of 4/10 (tan), as of 2/27 (green), and as of 5/15 (sky blue), all in %. Source: Treasury.
My interpretation: 1 to 3 year maturities fell as “Liberation Day” tariffs heightened fears of a slowdown. Continued policy uncertainty and lowered Fed funds rates kept pushing down yields at all horizons until the eve of the War. Then the war pushed up the anticipated short rate 3 months hence (relative to prior expectations), and higher inflation at the 6-month to 10-year horizon. Presumably, elevated deficits associated with war expenditures also put upward pressure on the long end.
Higher sovereign risk might also explain the steepening of the curve as of 5/15, as 5yr CDS spreads on Treasurys have risen from 31 to 37 today.



Comments
Log in or sign up to join the conversation.