

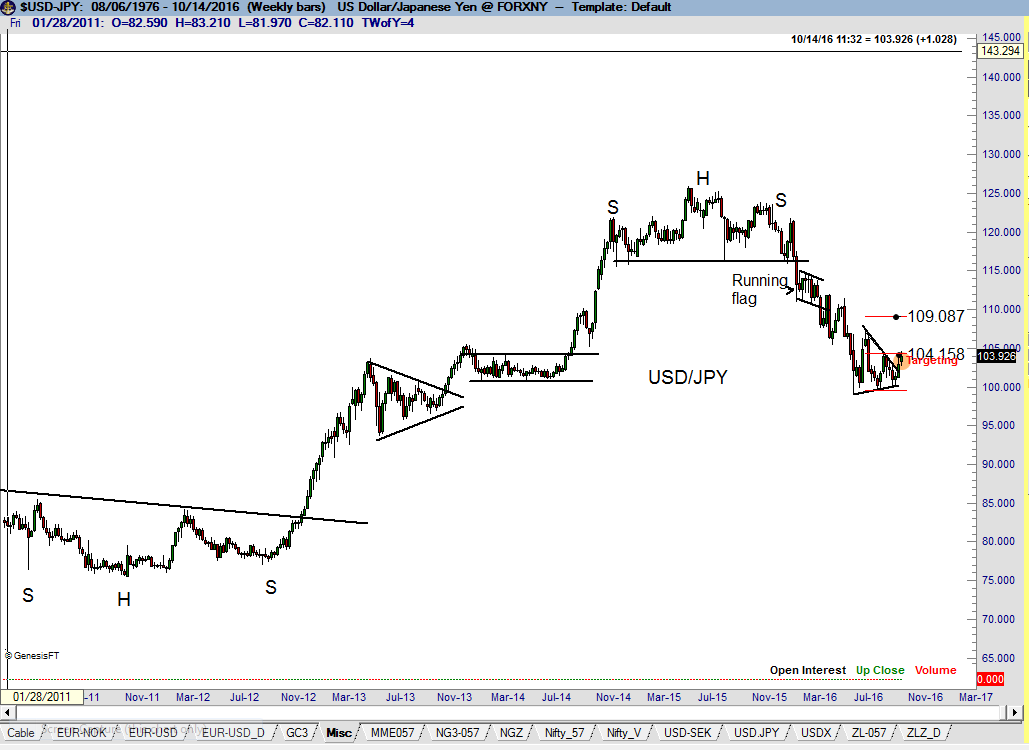
The Yen Chart is a textbook charting market – it has a long history of providing very reliable pattern signals, as shown on the weekly chart dating back to early 2011.
(Click on image to enlarge)
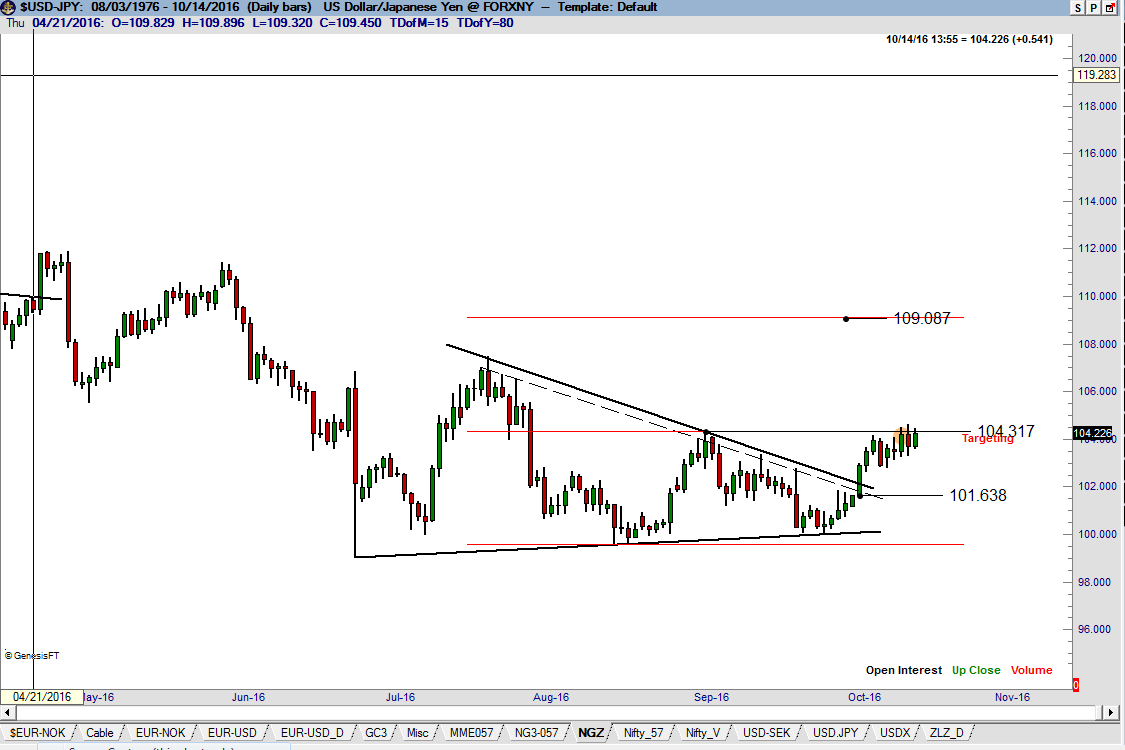
The advance on Oct 4 appears to have completed a possible 16-week symmetrical triangle bottom – remember that the symmetrical triangle pattern is far less reliable than horizontal patterns such as the H&S, rectangle and right angle-triangles. In order to be confirmed, a breakout of a symmetrical triangle bottom needs a decisive close above the last intermediate high in the triangle – marked as point #4 at 104.32 on the daily graph. A confirmed breakout on the Yen Chart would have a minimum target of 109.
(Click on image to enlarge)


Comments
Log in or sign up to join the conversation.