


Analysts remain constructive on biotechnology heading into the end of 2026. State Street highlights stronger biopharma innovation and improving industry fundamentals. Moreover, Fidelity expects M&A, innovation, and positive clinical data to remain important biotech catalysts. These trends should continue supporting investor interest in XBI through year-end.
J.P. Morgan also reports stronger public biotech performance and improving IPO activity during 2026. Meanwhile, M&A remains significant as larger drugmakers continue searching for external innovation. Therefore, analysts see a favorable backdrop for biotechnology during the final quarter. However, XBI can remain volatile because smaller biotech companies still depend heavily on funding and clinical results.
Elliott Wave Structure: XBI Weekly Chart August 22nd 2026
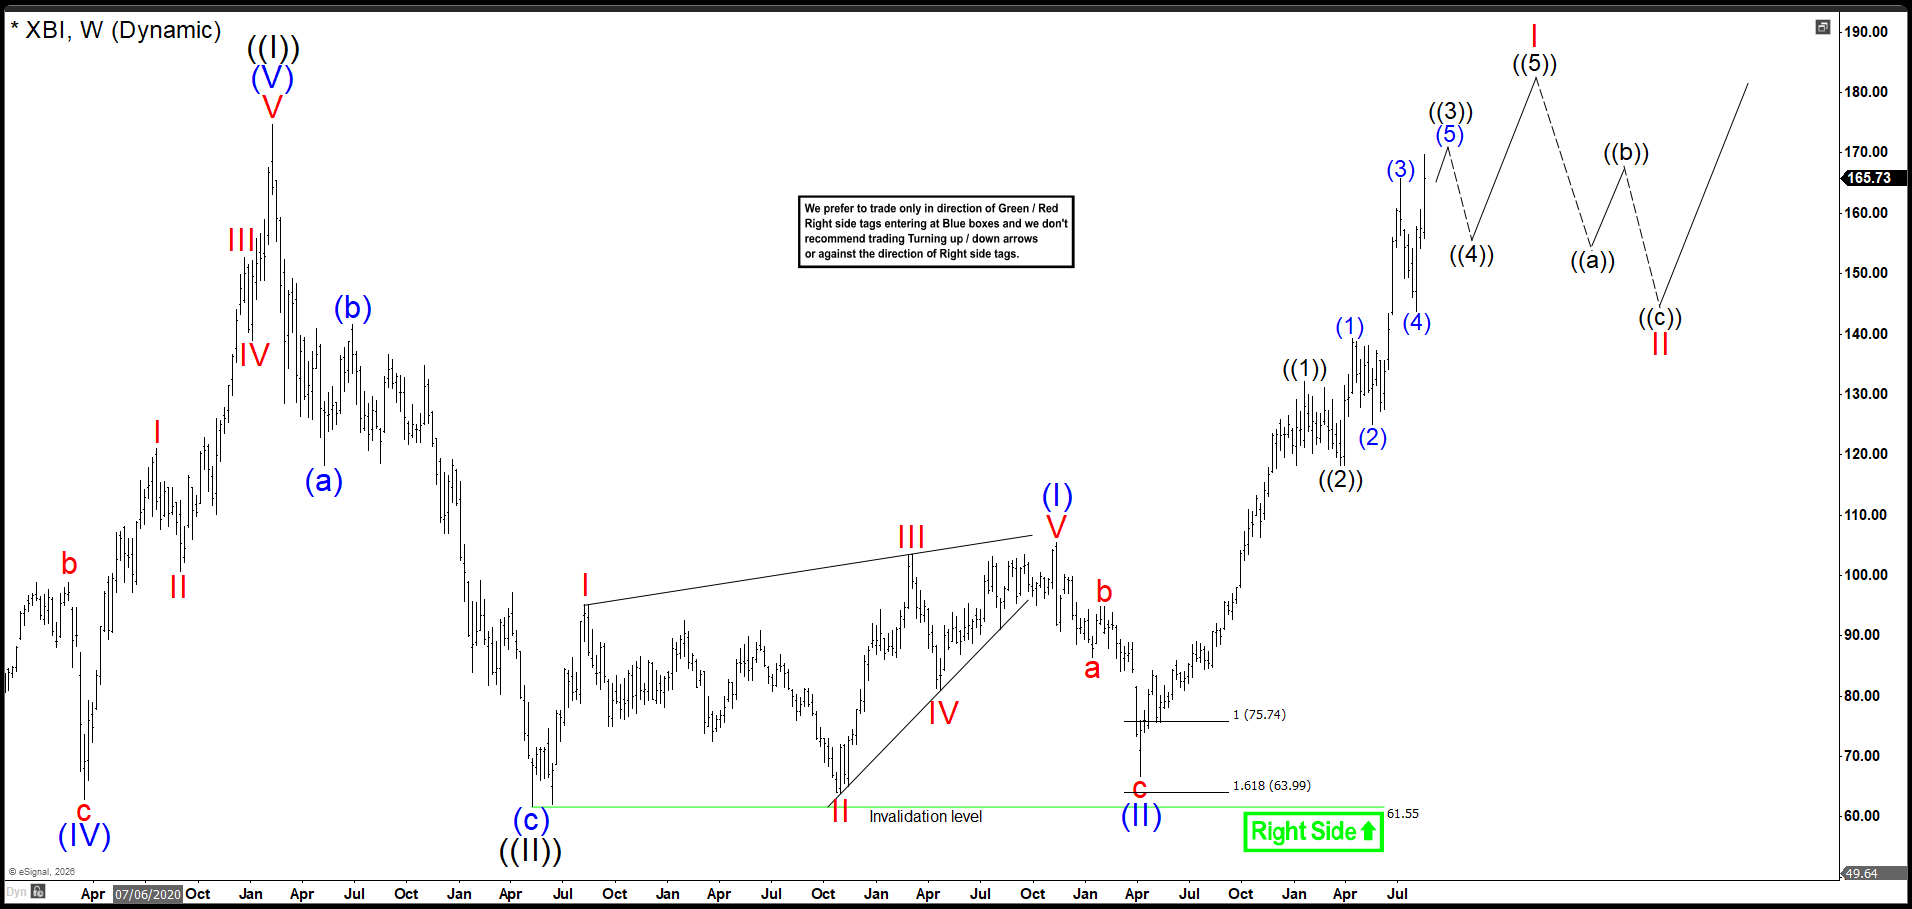
In August, we expected investors to get another opportunity to buy XBI at better prices. However, wave ((2)) remained extremely shallow and ended much earlier than expected. The bullish breakout then removed the possibility of a deeper wave II correction. Instead, wave I continued extending higher.
At that time, we believed XBI still had enough room to complete the impulse within wave I. Therefore, we expected the ETF to reach new all-time highs before the end of 2026. We also considered wave ((3)) close to completion unless another extension developed.
After wave ((3)) ended, we expected wave ((4)) to produce a corrective pullback. However, we did not expect that decline to complete wave I. Instead, we expected another rally in wave ((5)) to finish the terminal impulse.
Therefore, our broader outlook remained bullish through year-end. We expected XBI to finish 2026 above those levels. Only after the complete five-wave structure ended would we look for evidence that wave II had started.
Elliott Wave Principle Behind the Market Structure
Impulse
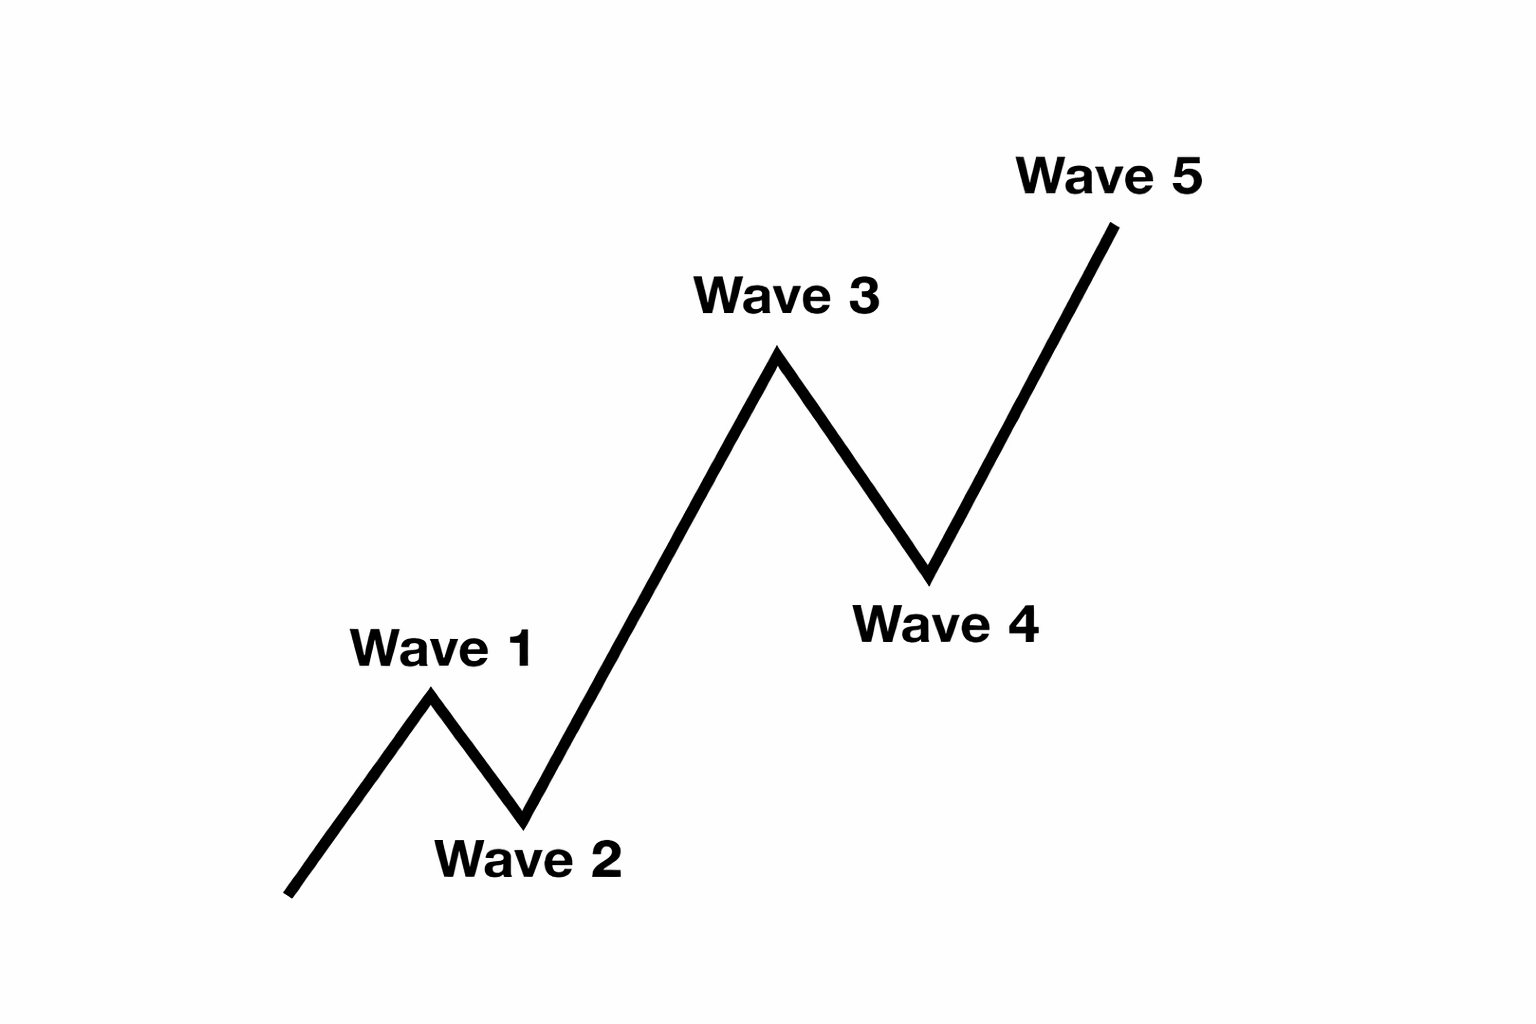
An impulse is a clean 5‑wave pattern that drives the trend forward.
Waves 1‑3‑5 are strong and directional.
No overlap between waves 1 and 4.
Wave 3 is usually the strongest.
Structure is clear, with increasing momentum.
Elliott Wave Structure: XBI Weekly Chart November 2026
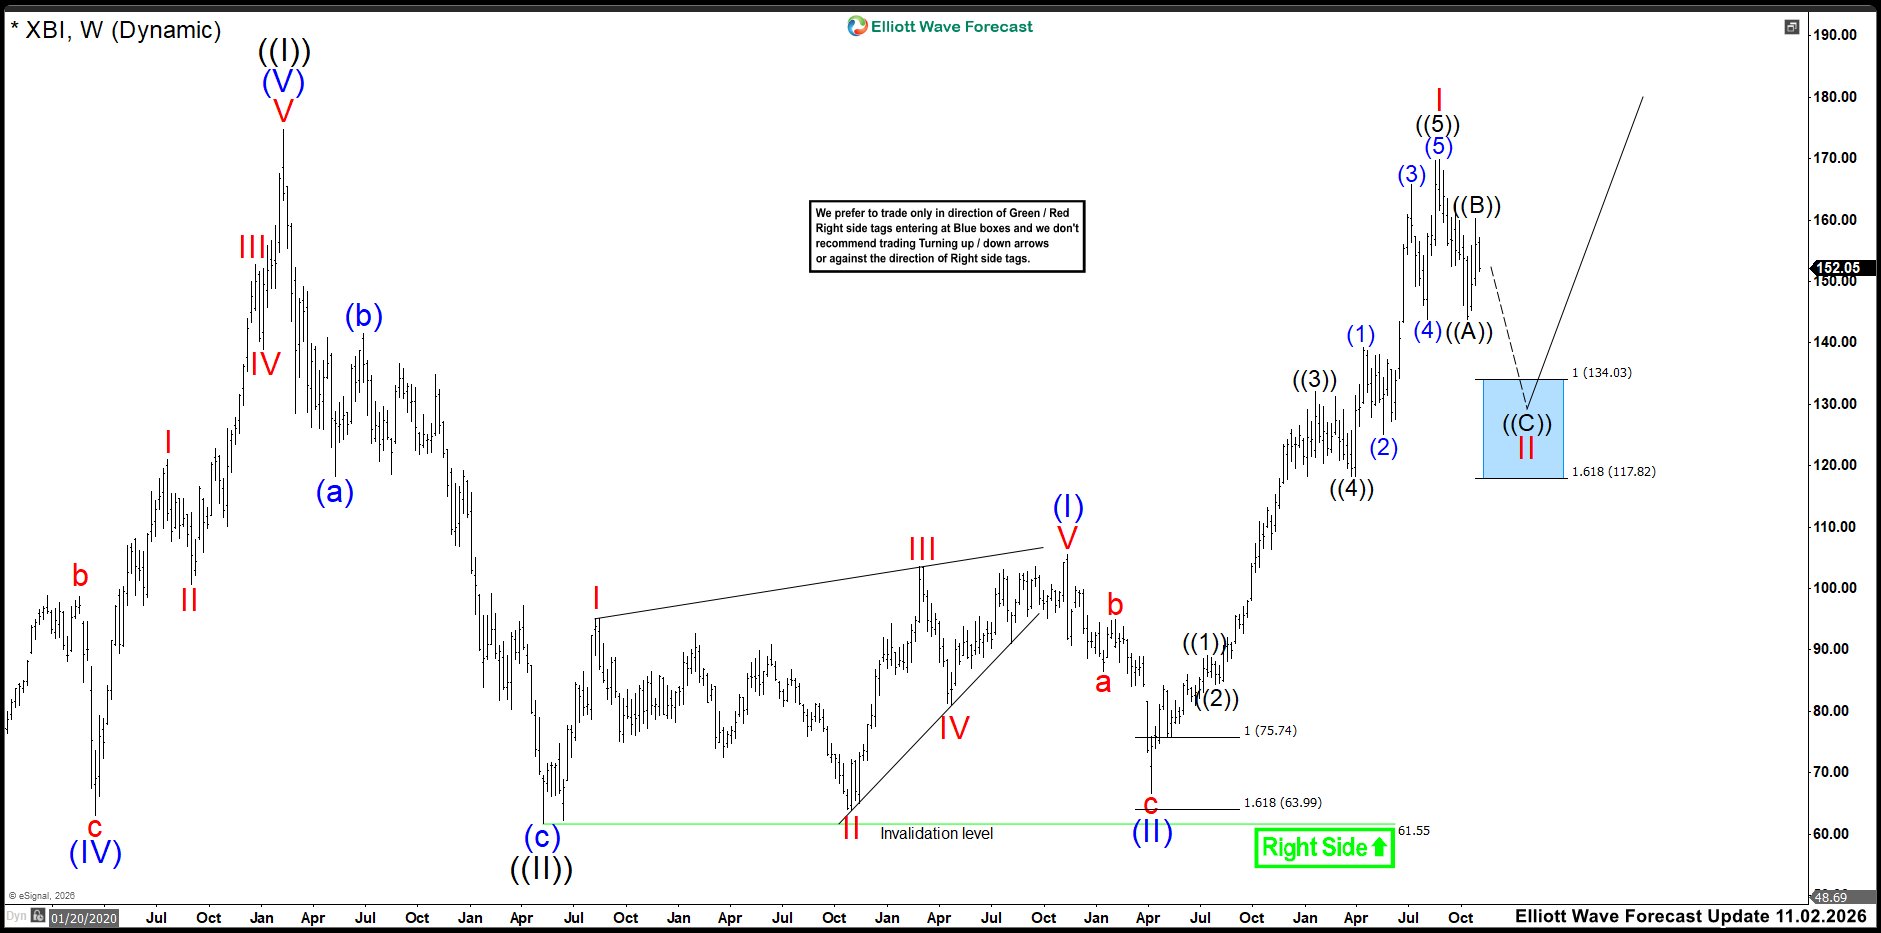
XBI maintains a bullish long-term sequence from the April 2025 low. The rally developed impulsively and completed wave I near the recent highs. Moreover, the advance subdivided clearly into five waves, supporting the larger bullish outlook.
Currently, XBI appears to be correcting that advance in wave II. Wave ((A)) ended near 140, while wave ((B)) developed a corrective rebound. Therefore, another decline in wave ((C)) should complete the correction. The Blue Box area comes between 134.03 and 117.82.
Once wave II finishes, buyers should regain control and begin the next major advance. The next rally should eventually break the wave I high and continue the bullish sequence. However, the correction could remain volatile before reaching completion. As long as 61.55 remains intact, the broader bullish structure stays valid.



Comments
Log in or sign up to join the conversation.