


Silver (XAG/USD) remains under pressure on Tuesday as a stronger US Dollar (USD) and rising US Treasury yields continue to weigh on the precious metal amid growing expectations that the Federal Reserve (Fed) may need to raise interest rates to tackle rising Oil-driven inflation pressures. At the time of writing, XAG/USD is trading around $74.76, down more than 3.5% on the day after hitting an intraday low near $73 earlier in the day.
US-Iran negotiations remain deadlocked over disagreements surrounding Tehran’s nuclear programme, while the Strait of Hormuz remains largely closed. US President Donald Trump said on Tuesday that military action against Iran could resume within the next few days or by early next week if no agreement is reached.
The ongoing uncertainty is keeping the US Dollar supported, with the US Dollar Index (DXY), which tracks the Greenback’s value against a basket of six major currencies, hovering near more than one-month highs around 99.33.
Meanwhile, hawkish Fed expectations continue to push US Treasury yields sharply higher, with the benchmark US 10-year Treasury yield climbing to a 16-month high near 4.687% on Tuesday, while the US 30-year Treasury yield rose to around 5.197%, its highest level since July 2007. Higher yields increase the opportunity cost of holding non-yielding assets such as Silver.
According to the CME FedWatch Tool, traders now see nearly a 32% probability of a 25 basis point (bps) Fed rate hike at the October meeting, rising to around 40% for December.
Technical Analysis:
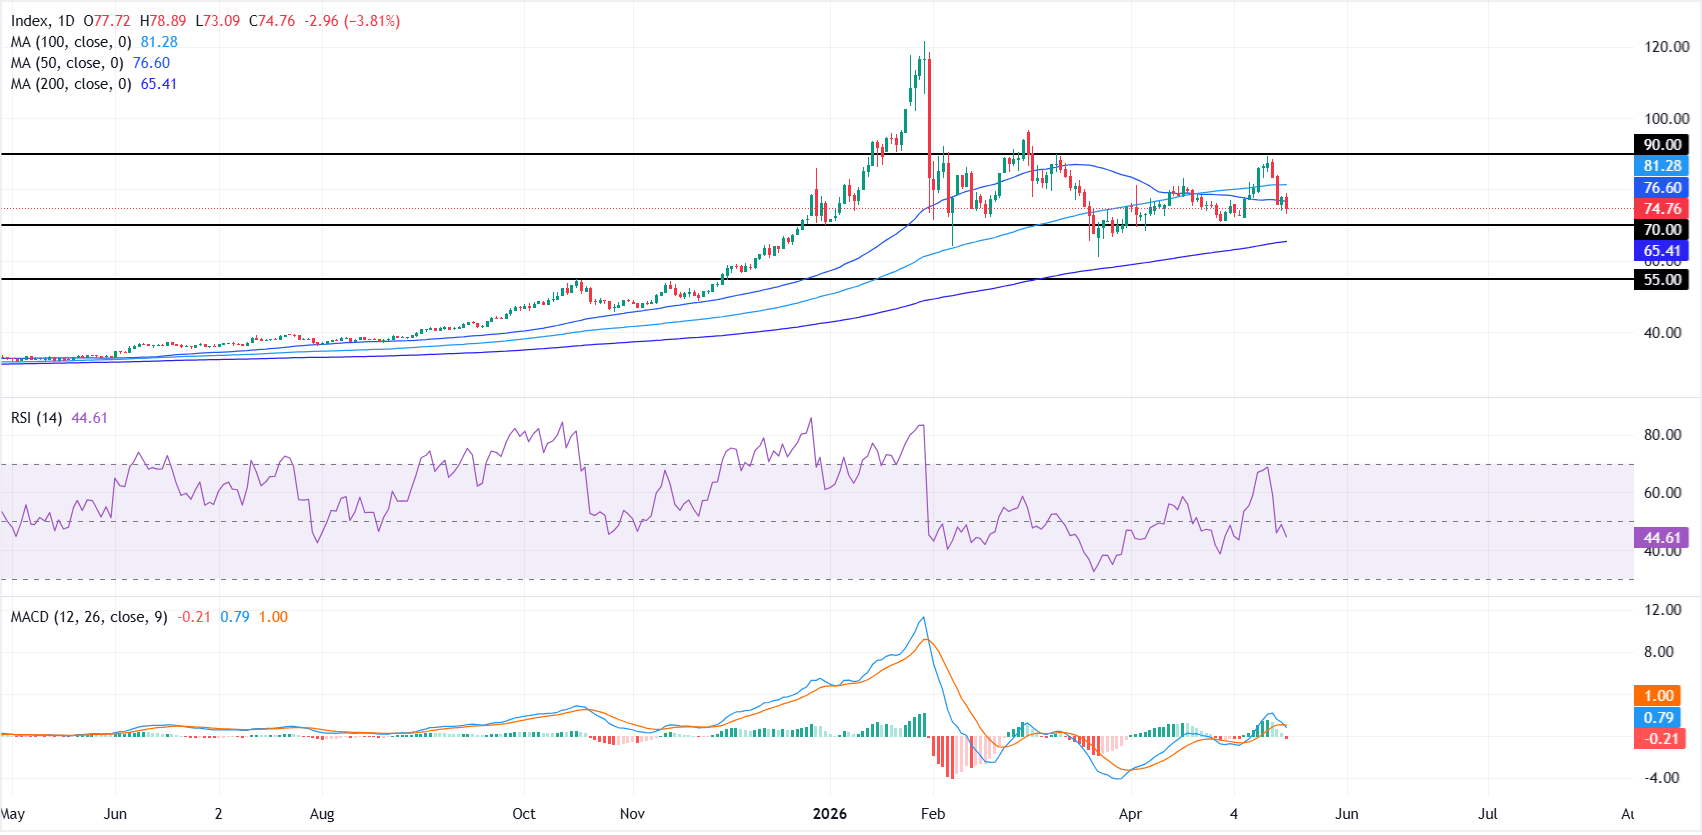
On the daily chart, XAG/USD holds a mildly bearish near-term bias as it sits below the short-term trend defined by the 50-day Simple Moving Average (SMA) at $76.60 while remaining above the longer-term 200-day SMA at $65.40.
The 100-day SMA at $81.28 strengthens the overhead supply zone, suggesting rallies face increasing headwinds, while the Relative Strength Index (RSI) around 45 leans soft but not oversold, and the Moving Average Convergence Divergence (MACD) has slipped back below zero, hinting that bullish momentum has faded.
On the topside, initial resistance is located at the 50-day SMA near $76.60, ahead of the 100-day SMA near $81, with a more distant cap at the horizontal barrier around $90.00.
On the downside, first support emerges at the $70.00 horizontal level, followed by the 200-day SMA at $65.40, with a deeper cushion near the longer-term floor around $55.00 if selling pressure accelerates.

Comments
Log in or sign up to join the conversation.