


West Texas Intermediate (WTI) – the benchmark US Crude Oil price – attracts some buyers during the Asian session on Tuesday, snapping a four-day losing streak to sub-$91.00 levels, or a nearly two-week low touched the previous day. The commodity currently trades just below the $93.00 mark, up around 1.40% for the day, as the focus remains on the Middle East crisis.
In the latest developments, Iran's Islamic Revolutionary Guard Corps (IRGC) warned on Monday that it would change the geography of the war if the US escalates the conflict. This keeps the geopolitical risk premium in play and acts as a tailwind for crude oil prices. Meanwhile, improving shipments through the Strait of Hormuz and rising hopes for US-Iran talks at the UN General Assembly might cap the upside for the black liquid.
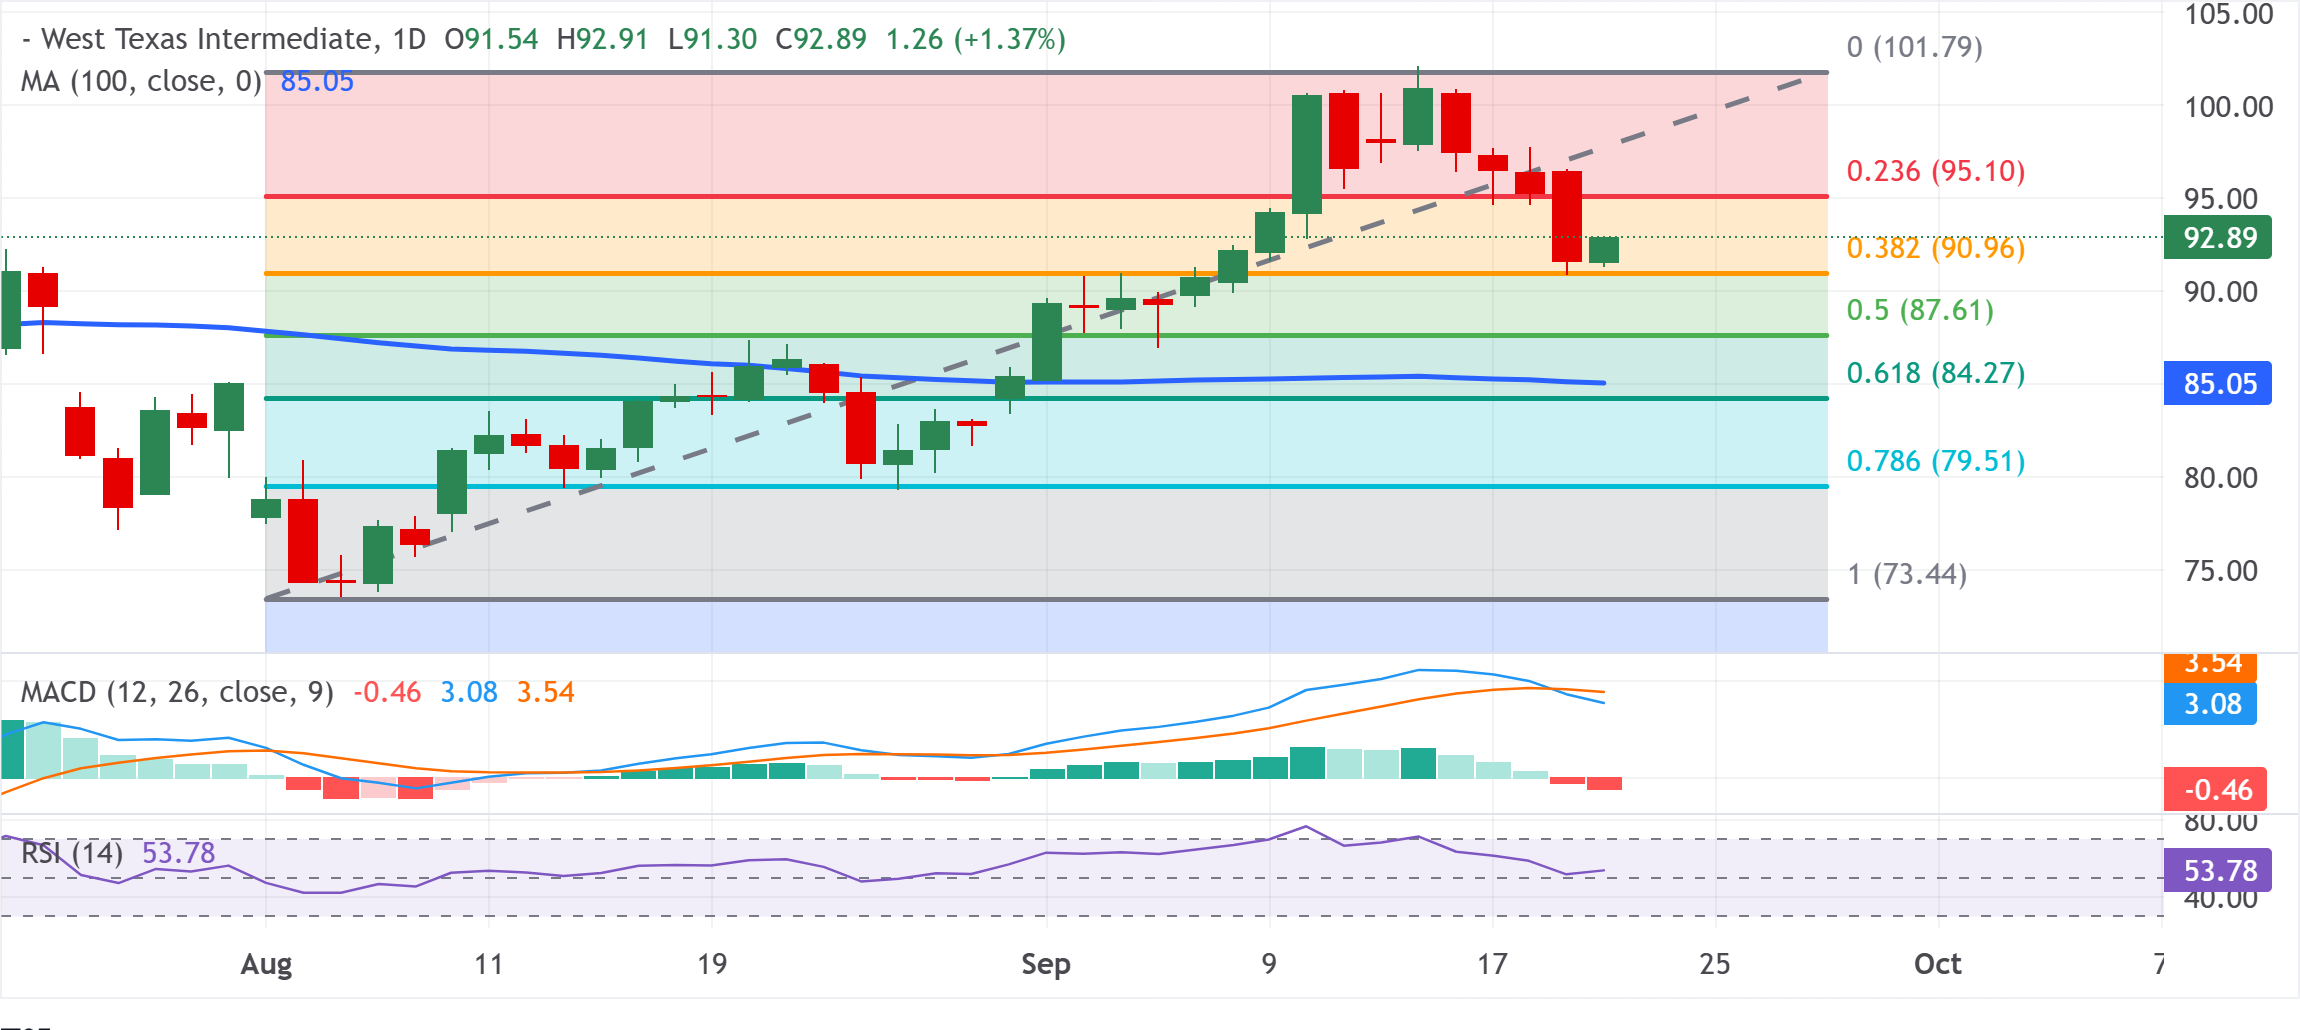
Crude oil prices hold a bullish bias above the 100-day simple moving average (SMA) at $85.05 and a Fibonacci support band between the 61.8% retracement at $84.27 and the 38.2% retracement at $90.96. That said, momentum indicators have eased, with the Relative Strength Index (RSI) hovering near a neutral 54 and the Moving Average Convergence Divergence (MACD) slipping below its signal line and turning negative on the histogram.
The technical setup, in turn, suggests the latest pullback is more a consolidation within an uptrend than a full-fledged reversal while oil prices stay supported over these structural levels. Meanwhile, weakness below the 38.2% Fibo. level at $90.96 would expose the 50.0% retracement at $87.61 and the deeper 61.8% level at $84.27, all reinforcing the underlying demand zone ahead of the 100-day SMA at $85.05 and lower Fibonacci anchors at $79.51 and $73.44.
On the topside, immediate resistance emerges at the 23.6% retracement at $95.10, with a break above this threshold exposing the cycle high region near $101.79, where buyers could begin to face more pronounced profit-taking pressures.
WTI daily chart



Comments
Log in or sign up to join the conversation.