

Right after our regular Market Review, this week's issue looks again at WTI crude oil from the perspective of the Commitment of Traders report.
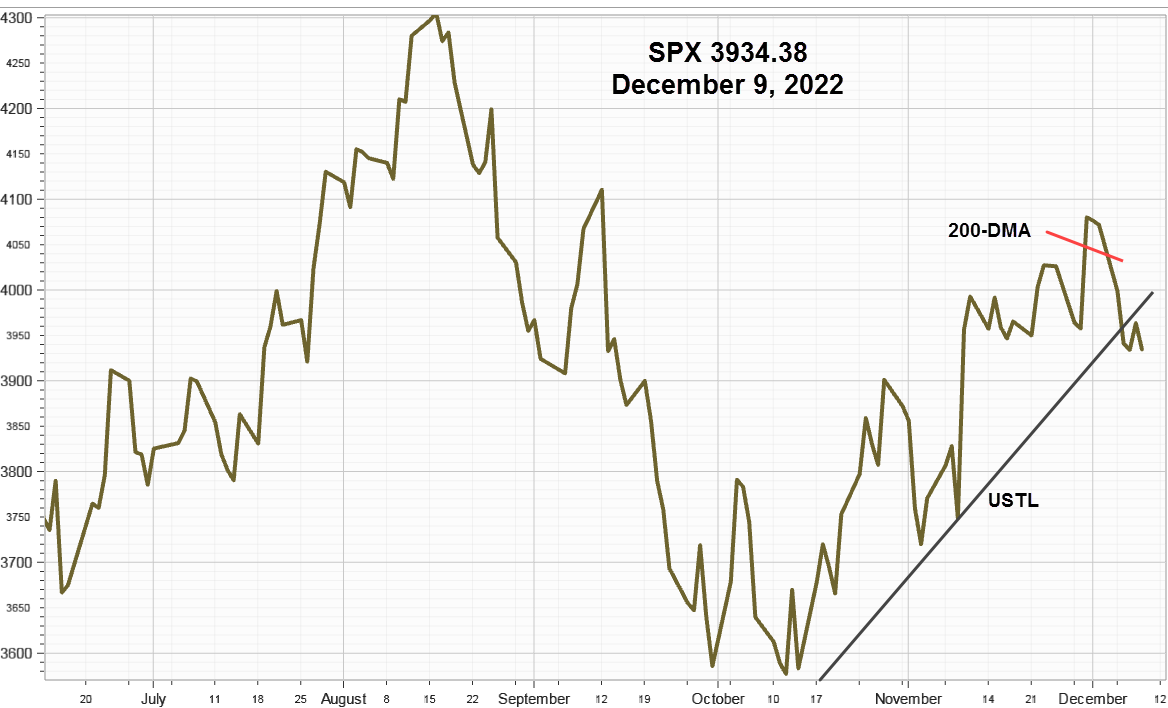
S&P 500 Index (SPX) 2826.06 declined once again last week, this time 33.47 points lower or -1.17% closing well below the 50-day Moving Average after creating enough data points to begin defining a new downward sloping trendline from the May 1 high at 2954.13. While support at 2800 continues to hold it could be tested soon as sentiment changes regarding a resolution to the China trade talks.
CBOE Volatility Index® (VIX) 15.85 declined only -.11 points or -.69% last week. Our similar IVolatility Implied Volatility Index Mean, IVXM using four at-the-money options for each expiration period along with our proprietary technique that includes the delta and vega of each option, gained .38 points or +2.75 %. Here is the chart with the SPX chart below.


VIX Futures Premium
The chart below shows as our calculation of Larry McMillan’s day-weighted average between the first and second month futures contracts.
With 17 trading days until June expiration, the day-weighted premium between June and July allocated 85% to June and 15% to July for a 7.21% premium vs. 6.03% for the week ending May 17, still below the green zone between 10% to 20% associated with S&P 500 Index uptrends. Disappointing the bulls once again.

The premium measures the amount that futures currently trade above or below the cash VIX, (contango or backwardation) until front month future converges with the VIX at expiration.
On Friday before the Memorial Day holiday, both VIX options volume and ending open interest were low as well as the combined SPX stock volume. They should all crank up again starting Tuesday.
For daily updates, follow our end-of-day volume weighted premium version located about half-way down the home page in the Options Data Analysis section on our website.
WTI Crude Oil
WTI Crude Oil (CL) 58.63 basis July futures were down 4.29 points or -6.82% for the week, after making a second leg down last Thursday and now well below the upward sloping trendline from the December 24 low, as shown in the chart below. There is something more than the seasonal tendency going on here.

From the Disaggregated Commitments of Traders - Options and Futures Combined report as of May 21, "Managed Money,” the group that best correlates with crude oil price changes and arguably the most important, reduced their long position 21,836 contracts after reducing them 10,858 as of May 14, and increased their shorts 743 contracts after increasing them 2,066 as of May 14 for a net position decrease of 35,503 contracts representing 8.67% of the open interest. The charts below help to show the changes for the last two reports.
For details describing the various reporting categories see Digest Issue 19 "Turnaround Friday." This short version of a long story gets right to the "Managed Money" charts.
Based on the number of long and short contracts sold, changes in the charts below don't seem very significant since the open interest also declined substantially shown in the last chart. Since May 21 was also the expiration date for June contracts, declining open interest is normal, however, this time it appears extreme and ends an uptrend that began March 19 suggesting or perhaps confirming the change in price trend now underway.


Open interest declined 270K contracts to 2,717,211. The extent of the gain this week, with July as the front month, should offer a clue about the degree of enthusiasm to return to this unstable market. Our take: wait and see.

As for seasonality, WTI crude oil tends to advance from January to August or September after pausing in May and June before continuing higher as mentioned in Digest Issue 19" Turnaround Friday," however, missing was any reference to the US Dollar Index (DX).
Usually negatively correlated with brief periods of positive correlation, like from April 1 to April 26 when both were advancing until DX closed at 98, the day WTI closed down 1.90 at 63.38, and below the upward sloping trendline, USTL from the December 24 low. See the small number 1 arrow in the chart below. Then as DX pulled back, WTI consolidated turning modestly higher until DX again challenged 98, once again last Thursday advancing as high as 98.37 before reversing to close at 97.86 (number 2 arrow). While WTI had declined Wednesday on a higher than expected EIA inventory report, DX really whacked it Thursday declining 3.51 to close at 57.91.

After considering both positive and negative fundamentals, it seems DX reflects Risk Off sentiment including unwinding carry trades that are increasing the sensitivity of crude oil prices to macro variables.
As a reminder, here is our Macro Bus with DX in the driver's seat.

In case the labels on the passengers hats are hard to read they are Crude Oil, Gold, Treasuries, Equities. Hidden in the back are other commodities as well.
Strategy
With all the China trade rhetoric along with increasing macro sensitivity increasing hedges for longs with collars or put spreads while option prices are still fairly reasonable continues to be sensible
With respect WTI crude oil above, following a trend requires a method to determine when it ends, such as trendline or perhaps a 50-day Moving Average. Remember trade rule number 9, "Trade what you see not what you think."
Summary
As China trade and tariff rhetoric increases uncertainty, markets are becoming more sensitive to macro variables including all the ramifications for trade, global growth and currency flows from a rising US Dollar Index. For now, most indicators continue suggesting caution.
Comments
Log in or sign up to join the conversation.