


WTI crude oil is breaking out of a triangle consolidation pattern, surging from the $82.00 region to a fresh swing high near $86.89 in a sharp late-August rally that confirms a shift toward a new short-term uptrend.
Since topping out just below $87.00, price has pulled back slightly and is now hovering around the $85.50 area, drawing the Fibonacci retracement tool into play to gauge where buyers could step back in.
The 38.2% Fib at $85.15 is the first line of defense, with the 50% level at $84.61 and the 61.8% Fib at $84.07 offering deeper support zones if the pullback extends. Notably, the rising trend line connecting the late-August higher lows also converges with this Fib cluster, reinforcing the case that this area could hold as a floor for the current uptrend.
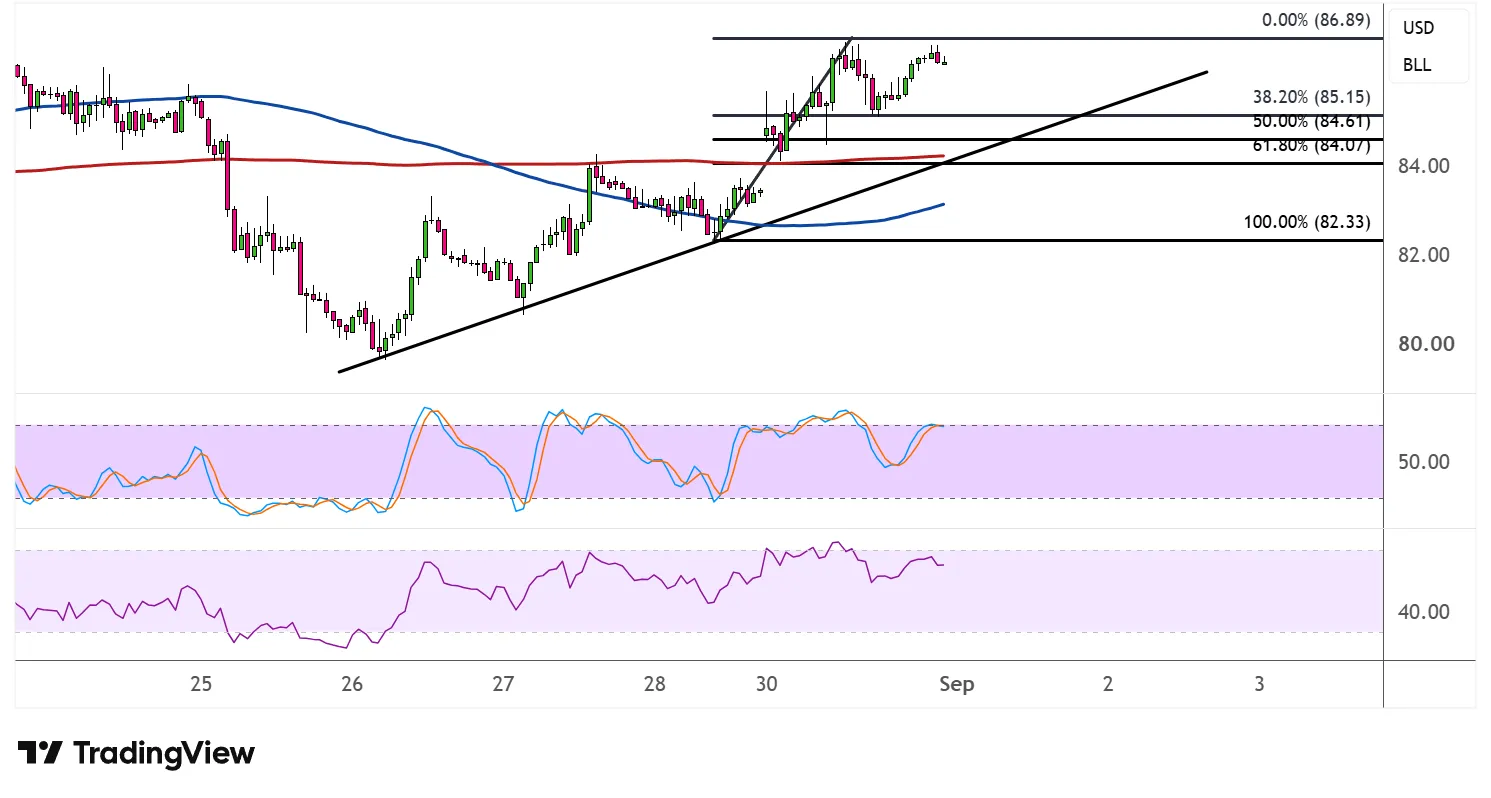
The 100 SMA has turned higher and is now crossing above the 200 SMA, a bullish signal suggesting that the path of least resistance has shifted to the upside. Both indicators are still below current price, so they could serve as additional dynamic support if the correction deepens further.
Stochastic has climbed back toward the overbought region after cycling out of oversold territory multiple times over the past week, reflecting the strength of the recent rally, although a turn lower here could hint at some near-term exhaustion among buyers.
RSI, meanwhile, has pushed back above the 50 mark after spending much of the prior week below it, indicating that bullish momentum is gaining traction. As long as RSI holds above this threshold, the broader uptrend bias remains intact.
If the Fib and trend line confluence holds, WTI crude oil could resume its climb toward new highs. A breakdown below the 61.8% Fib and trend line, however, could open the door to a deeper slide back toward the $82.33 swing low.
Elevated geopolitical tensions continue to keep the commodity supported, though hawkish Fed commentary leading up to the NFP release on Friday could bring dollar strength.



Comments
Log in or sign up to join the conversation.