

WTI crude oil has been trending lower on the short-term time frame, with price carving out a series of lower highs beneath the descending moving averages.
However, a potential double bottom formation appears to be taking shape near the $69.00 area, hinting that a reversal from the prevailing downtrend could be brewing.
The neckline of this double bottom pattern sits around the $72.00–$72.50 area, which also coincides with a highlighted resistance zone on the chart. A break above this ceiling would confirm the reversal signal, opening the door for a measured move higher.
On the other hand, a rejection at the neckline could indicate that sellers are not yet ready to surrender, keeping the downtrend intact and leaving the door open for another leg lower.
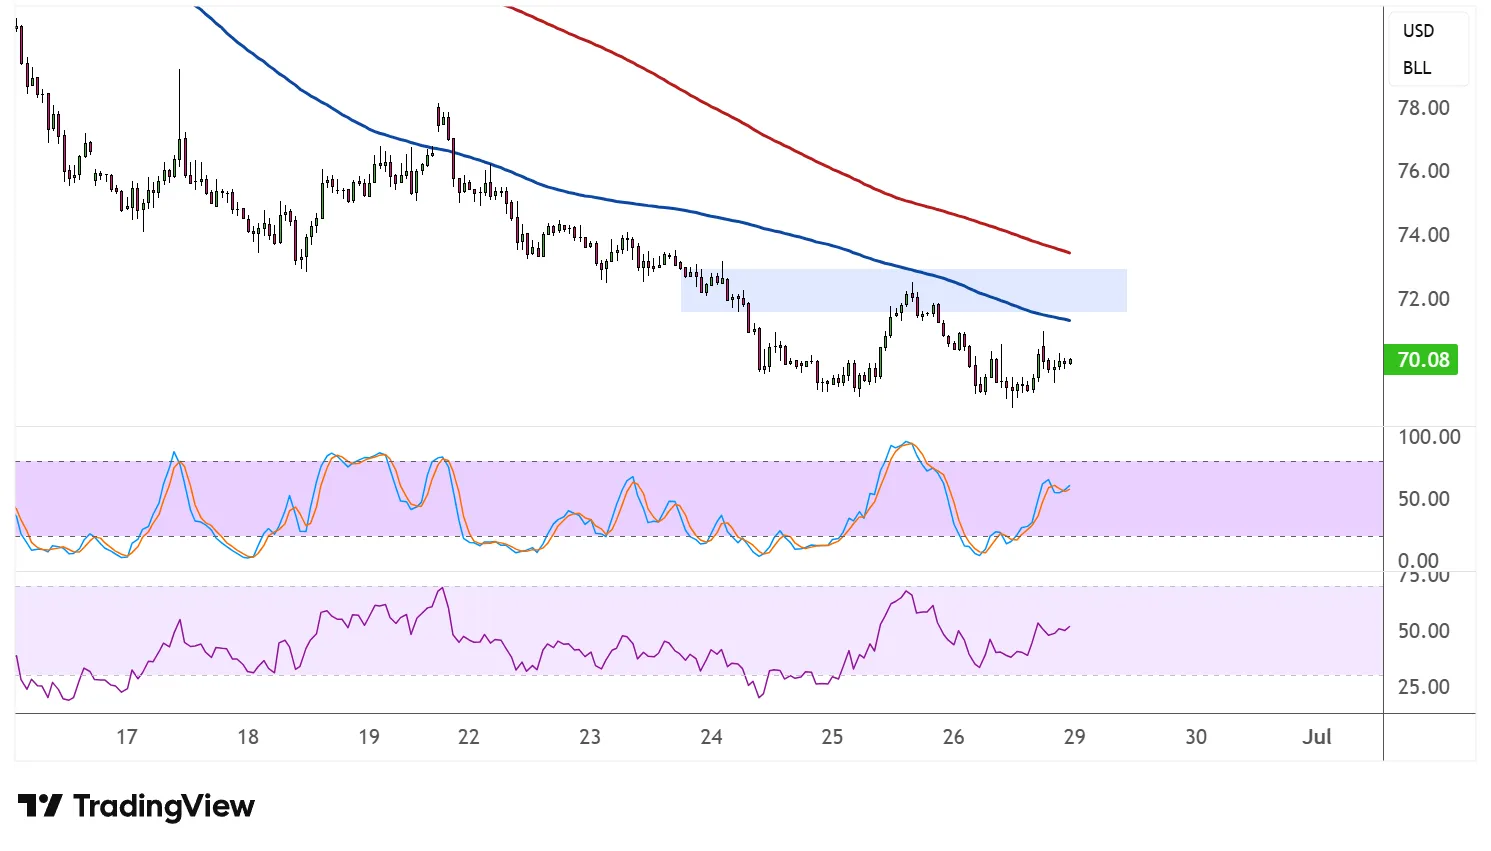
On the subject of moving averages, the 100 SMA remains below the 200 SMA, confirming that the path of least resistance is still to the downside. Both indicators are sloping lower and pressing down on price from above, reinforcing the broader bearish bias. The neckline resistance zone broadly aligns with the 100 SMA dynamic inflection point, adding another layer of supply to overcome.
Stochastic is turning higher from the midpoint after previously dipping near the oversold region, suggesting that buyers are starting to flex some muscle. The oscillator has room to climb toward the overbought area, which could give bulls enough momentum to test the neckline resistance.
RSI is also trending up from relatively subdued levels, with room to advance before reaching overbought territory. This lends further support to a short-term bounce attempt.
If the neckline holds as a ceiling, crude oil risks sliding back toward the double bottom lows around $69.00 or lower. A clean breakout above, though, could put the $74.00 region back in play.



Comments
Log in or sign up to join the conversation.