

WTI crude oil appears to be carving out a double bottom pattern on the short-term time frame, with the two troughs formed around the $85.00 area and price now attempting to push back toward the neckline resistance around $95.00.
A break above this ceiling would confirm the reversal pattern and open the door for a measured move rally of the same height as the formation, which could bring price back toward the $105.00 region.
Price is currently trading around $90.84, hovering just below the neckline zone highlighted by the shaded resistance area. Bulls will need to clear this hurdle convincingly before the next leg higher can gain traction.
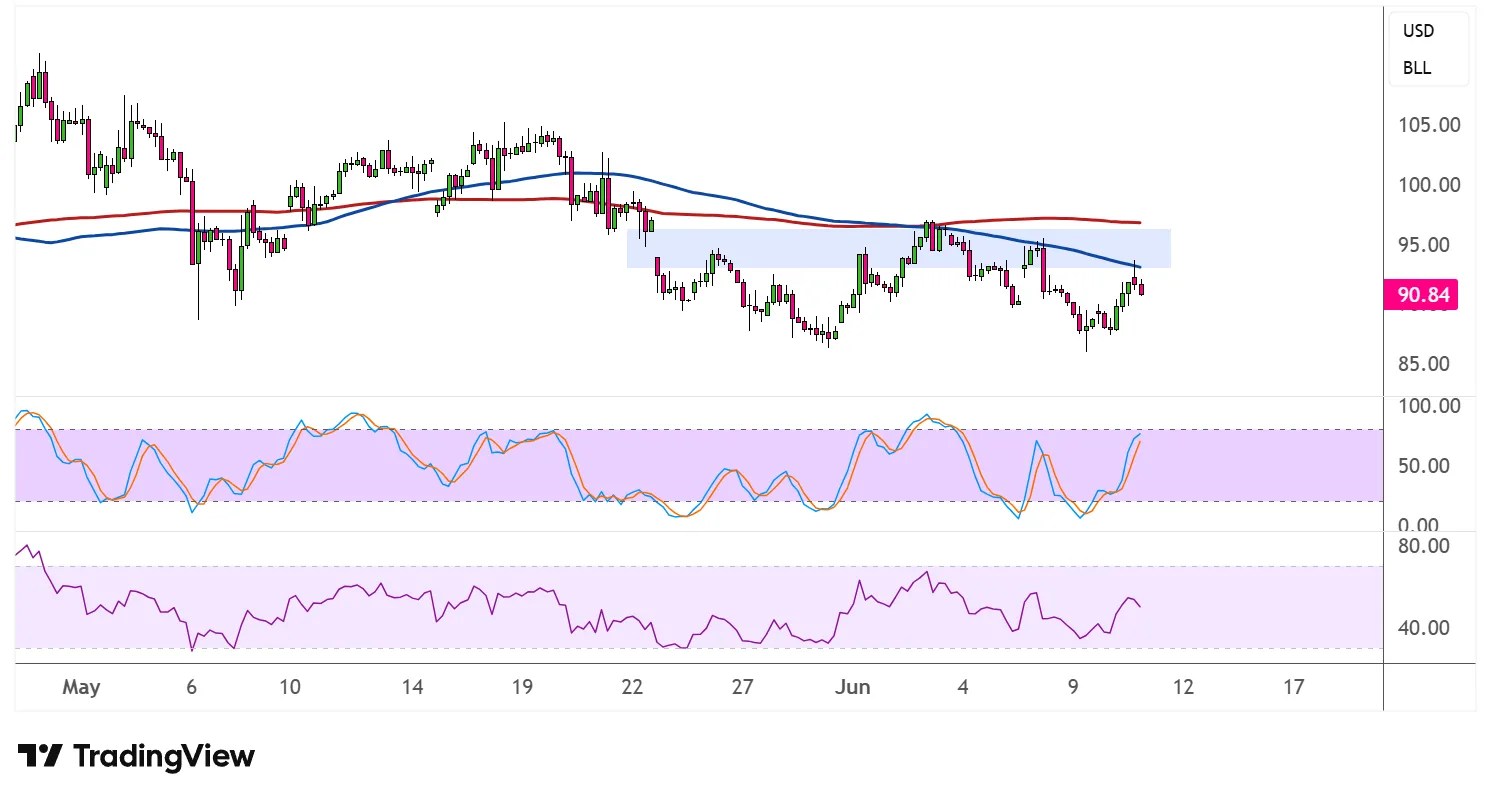
The 100 SMA (blue) is below the 200 SMA (red), however, confirming that the path of least resistance is still to the downside, or that sellers may have the upper hand in the bigger picture. Both moving averages are sloping relatively flat to slightly lower, so a decisive close above them would be needed to shift the broader bias back to the bulls.
On the oscillators, stochastic is surging higher from the oversold area and is approaching the overbought region, which reflects a strong return in buying pressure. The oscillator’s sharp upturn suggests that buyers are gaining momentum, though it could also signal that a brief pause may be ahead before the rally resumes.
RSI has also turned higher from its lower range and is climbing back toward the midpoint, giving buyers some room to push prices further before hitting overbought territory. This gives the bullish case a bit more breathing room.
Traders will likely be watching inventory reports closely, as a surprise draw in crude stockpiles could fuel the breakout above neckline resistance and accelerate the measured move higher. Further escalation in the Middle East could also keep global supply concerns elevated, adding upside for the energy commodity.



Comments
Log in or sign up to join the conversation.