

WTI crude oil is still stuck in a descending trend line that has capped rallies since late June, with the price recently testing this dynamic resistance around the $69.46 mark without much success.
A rejection here could pave the way for the selloff to resume, and the Fibonacci extension tool highlights where sellers could take the reins if the trend line holds.
The 38.2% level lines up at $67.69, followed by the 50% level at $67.14, both of which could be the first areas where a short-term bounce might stall out.
A deeper slide could drag the commodity down to the 61.8% level at $66.60 or the 76.4% level at $65.92, while a more substantial breakdown could set the stage for a test of the 100% extension at $64.82, which lines up with the broader downtrend’s objective.
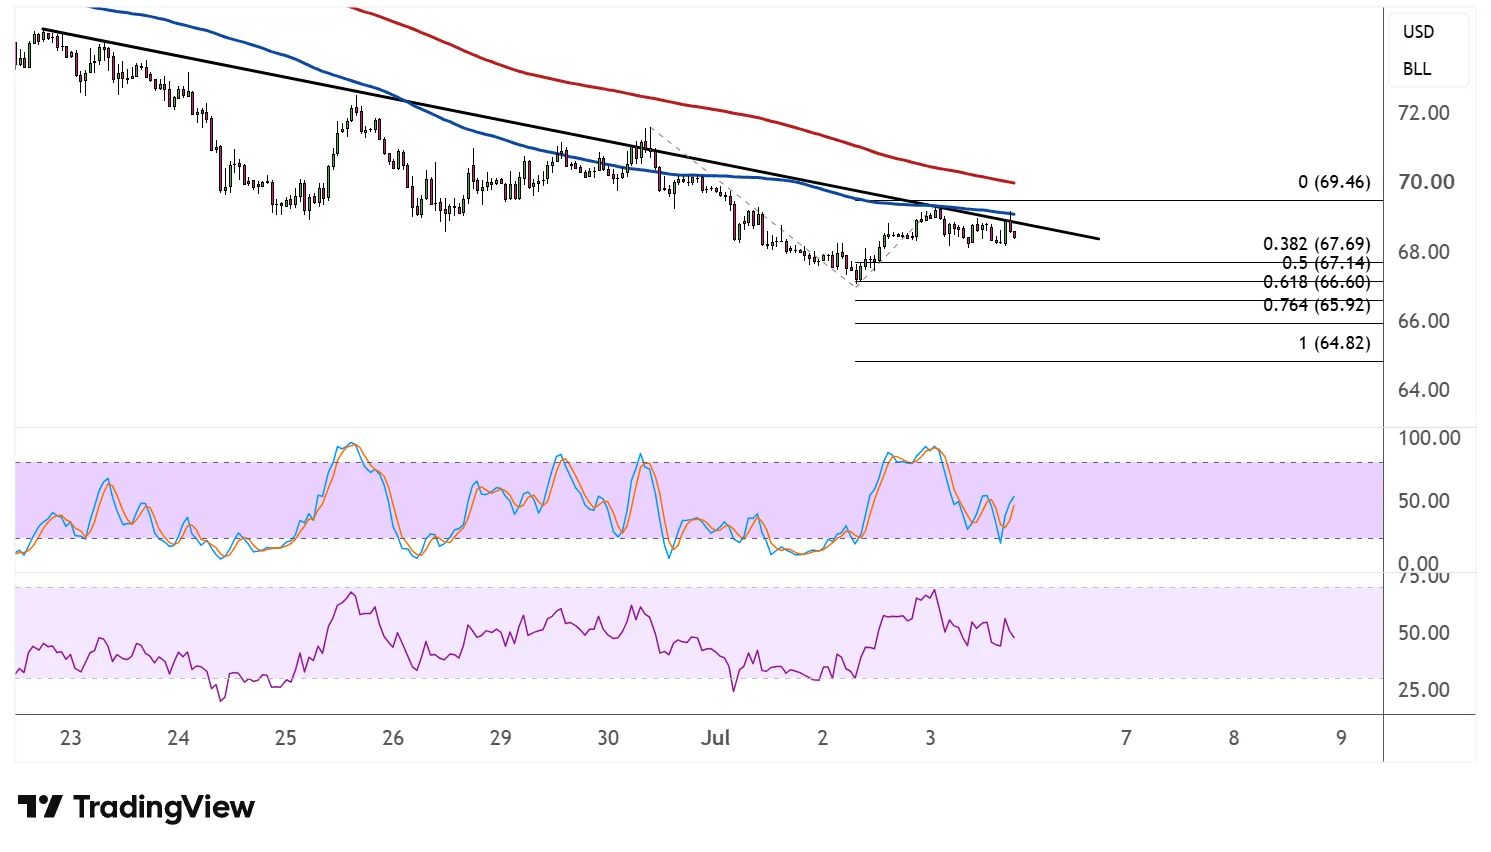
Looking at the moving averages, both the 100 SMA and 200 SMA remain above price and are still sloping downward, confirming that the path of least resistance is to the downside for now. The gap between the indicators also appears to be widening, a sign that bearish momentum could still have some room to build.
Stochastic has climbed back up from the oversold region and is now curling lower near the overbought zone, hinting that buyers are starting to run out of steam and that a return in selling pressure could be in the cards. The oscillator has plenty of room to fall before reaching oversold levels again, suggesting the correction lower could have some legs.
RSI is also turning down after failing to reclaim the midline, reinforcing the view that upside attempts are losing traction. With the indicator still short of oversold territory, there’s scope for further downside before dip buyers might attempt to step back in.
WTI crude oil remains on bearish footing as the US-Iran ceasefire continues to hold up and the war premium unwinds, though USD volatility could come in play during the FOMC minutes release.



Comments
Log in or sign up to join the conversation.