


WTI crude oil appears to be carving out a head and shoulders pattern on the daily chart, a classic reversal formation that could be signaling an end to the rally that carried price from the low $70s to the recent high near $88.
The left shoulder formed in mid-to-late July, the head printed shortly after near $87.80, and the right shoulder has now completed just below $85, with each peak lower than the last to reflect fading bullish momentum.
The neckline runs along the shaded support zone around $80.00, an area that also lines up with the swing lows from earlier in the month. A confirmed break and close below this level would validate the pattern and open the door to a measured move selloff, with the projected target obtained by subtracting the head-to-neckline distance from the breakdown point, landing somewhere in the $72.00 region.
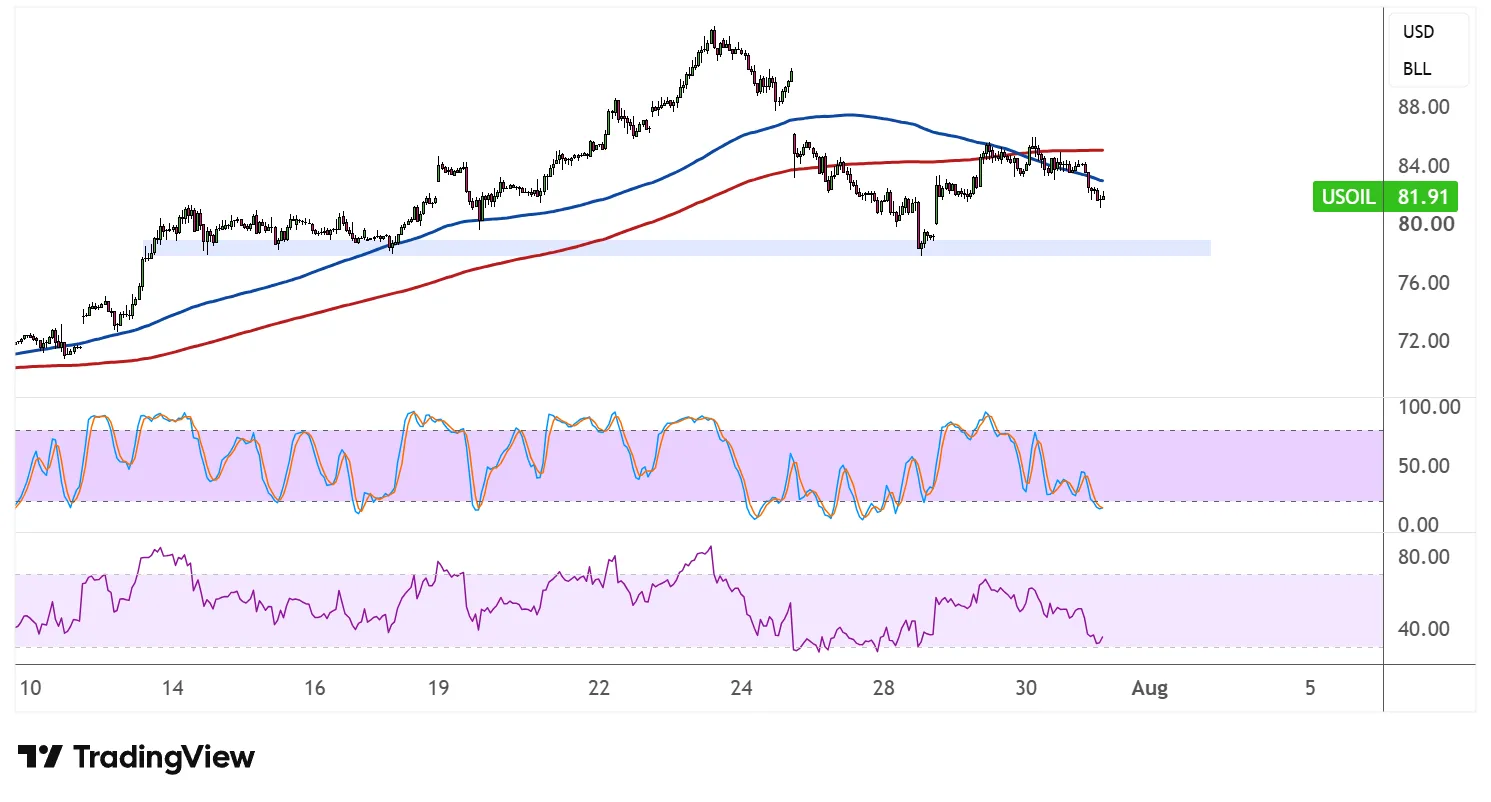
On the moving average front, the 100 SMA has already crossed below the 200 SMA, confirming that the path of least resistance has shifted to the downside. Price is trading beneath both averages, which could now act as dynamic resistance on any bounce attempts.
Stochastic has rolled over from the overbought zone and is trending lower, reflecting a return of selling pressure. The oscillator still has room to fall before reaching oversold territory, suggesting the correction could continue without much resistance from momentum indicators.
RSI tells a similar story, sliding toward the 40 handle after failing to sustain a push above 50, reinforcing the view that sellers are back in control.
A decisive close below the $80.00 neckline would strengthen the bearish case and put the measured move target around $72.00 in focus. On the other hand, a bounce back above the right shoulder near $85.00 could invalidate the pattern and shift attention back to retesting the $87.80 swing high.



Comments
Log in or sign up to join the conversation.