


WTI crude oil is attempting to break above a descending trend line that connected the lower highs from May through July, hinting that the downtrend which took price from the $98.17 highs down to the $66.28 low could be losing steam.
Price is now climbing above the 50% Fibonacci retracement level at $82.23 and appears to be making its way toward the 61.80% level at $85.99, which lines up closely with the still-descending trend line resistance from the broader pattern.
If crude oil manages to clear this confluence zone, the climb could extend to a retest of the 100% Fib and prior swing high near $98.17.
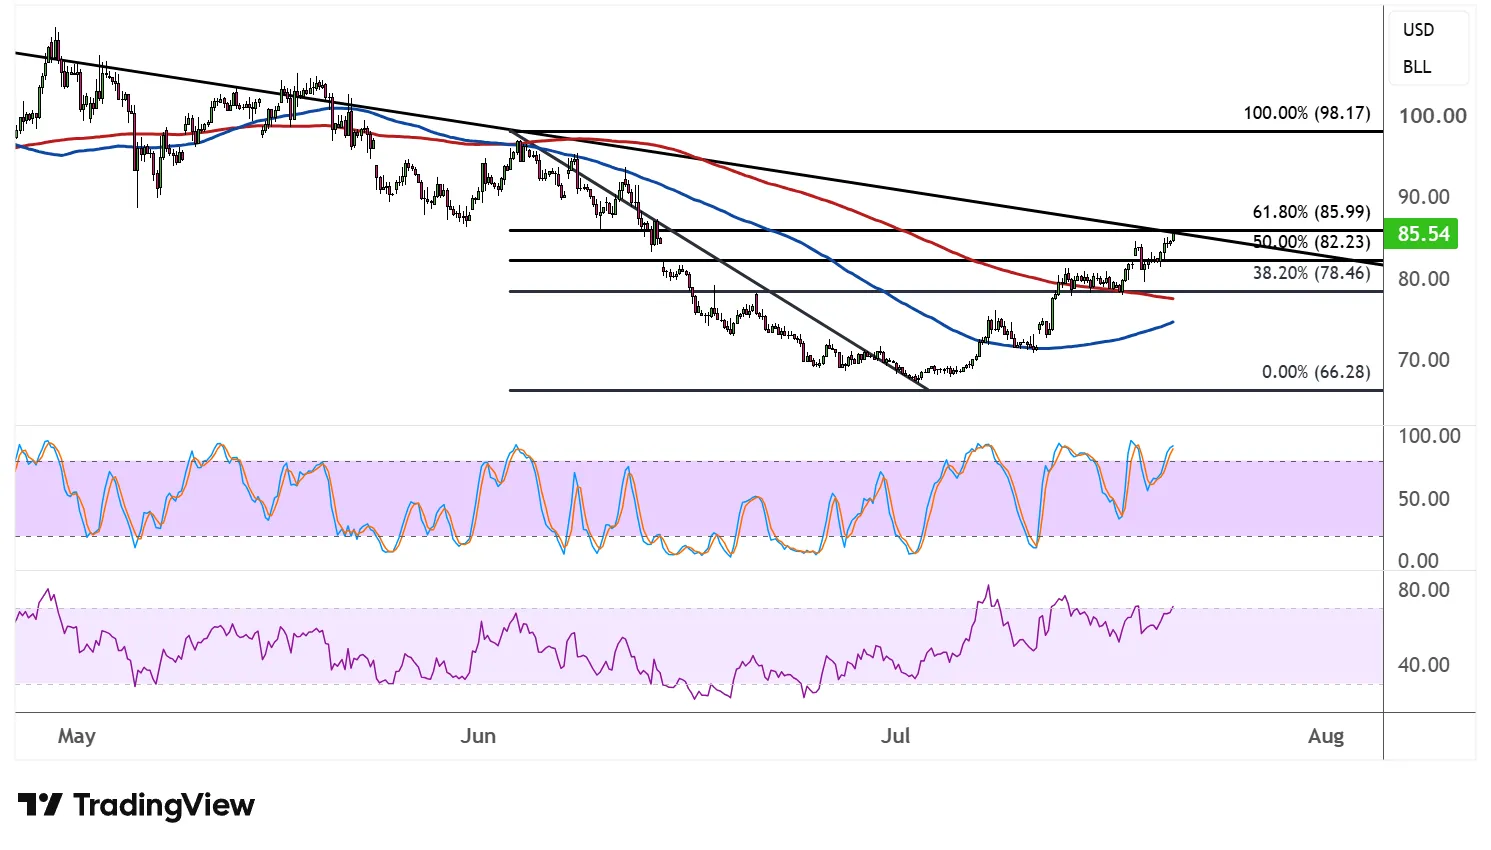
The 100 SMA has already curled higher and is now being tested as potential dynamic resistance, while the 200 SMA remains above price, still sloping down from the earlier decline.
Price trading above the 100 SMA and closing in on the 200 SMA suggests the path of least resistance may be shifting to the upside, though the wider gap between the two indicators shows the longer-term bearish structure hasn’t fully reversed.
Stochastic has climbed back into the overbought region, mirroring the conditions seen at several of the prior swing highs during the downtrend, which often preceded pullbacks. This raises the risk of a near-term correction even if the broader recovery attempt stays intact.
RSI is also pushing higher and nearing overbought territory, reflecting the strengthening bullish momentum behind the recent rally.
If RSI can hold up without turning lower, it would support the case for a leg higher toward the 61.80% Fib and beyond. A rejection here, however, could send WTI back toward the 50% or 38.20% retracement levels as it consolidates gains.
WTI crude oil could take cues from geopolitical developments, as escalating conflict between the US and Iran could prolong global supply concerns and lift prices. De-escalation, on the other hand, could mean downside for the commodity as it unwinds the war premium.



Comments
Log in or sign up to join the conversation.