

WTI crude oil is holding above a rising trend line that connects its late June lows, with price bouncing off this ascending support after a strong rally took the commodity from the $69.00 area up to a high near $76.70.
Since then, crude has been consolidating in a pullback, and the trend line appears to be doing its job of attracting dip buyers. The Fibonacci retracement tool, drawn from the swing low at $71.17 to the high at $78.41, highlights the levels being tested during this correction.
Price recently dipped toward the 38.2% Fib at $73.93 before stabilizing, with the 50% level at $74.79 and the 61.8% level at $75.64 serving as the next ceilings to watch if the climb resumes. A break above the most recent swing high near $76.70 could open the door to the 100% extension at $78.41.
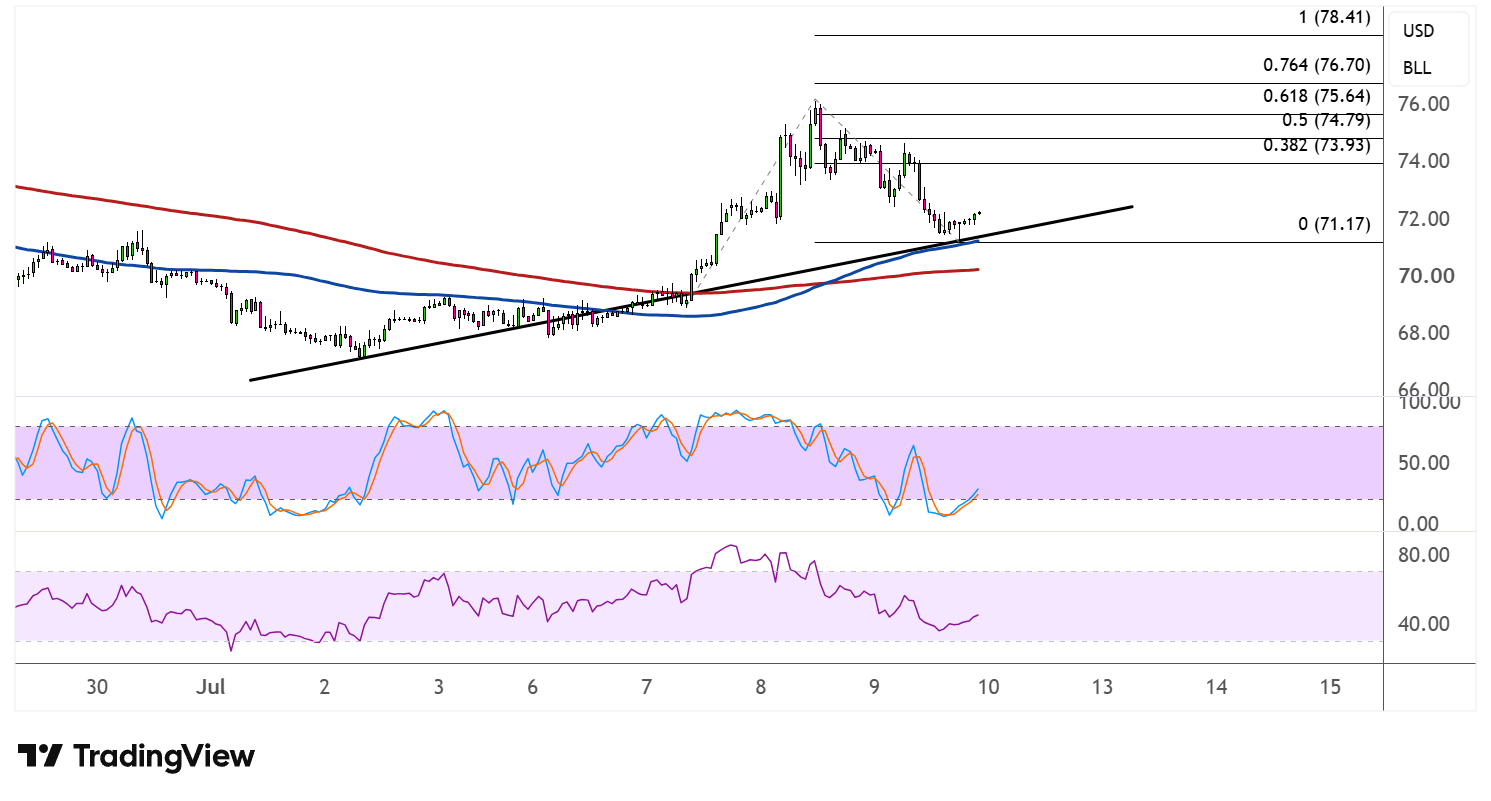
On the moving average front, the 100 SMA has climbed above the 200 SMA, confirming that the path of least resistance is tilted to the upside. Price is also holding above both indicators, which could reinforce their role as dynamic support on any further dips, alongside the rising trend line.
Stochastic recently dipped into oversold territory and is turning higher, hinting that a return in bullish momentum could be underway. The oscillator has plenty of room to climb before reaching overbought conditions, suggesting the rally has scope to extend if buyers keep pressing.
RSI is also curling upward after retreating from its highs, with ample room to climb before hitting overbought levels, which could allow price to keep following suit while buyers hold the upper hand.
If the trend line and near-term Fib levels continue to hold as support, WTI crude oil could resume its climb toward the 61.8% Fib or the 100% extension at $78.41. On the other hand, a break below the trend line could open the door to a deeper slide back toward the $71.17 low.



Comments
Log in or sign up to join the conversation.