


WTI crude oil broke down from its longer-term ascending trend line after topping out around the $87.57 mark, confirming a shift in momentum from the steady climb seen since early August.
Price has since carved out a range between roughly $79.67 and $84.55, with the broken trend line now potentially lining up as resistance on any recovery attempt.
The Fibonacci retracement tool highlights several levels where sellers could be waiting to cap upside moves. The 38.2% Fib at $82.69 is the first hurdle, followed by the 50% level at $83.62, which is closer to where the broken trend line and the 100 SMA dynamic resistance converge.
A stronger bounce could reach the 61.8% Fib at $84.55, which might be the line in the sand for a bearish continuation. If crude oil is unable to clear these levels, the slide could resume toward the $79.67 low or lower.
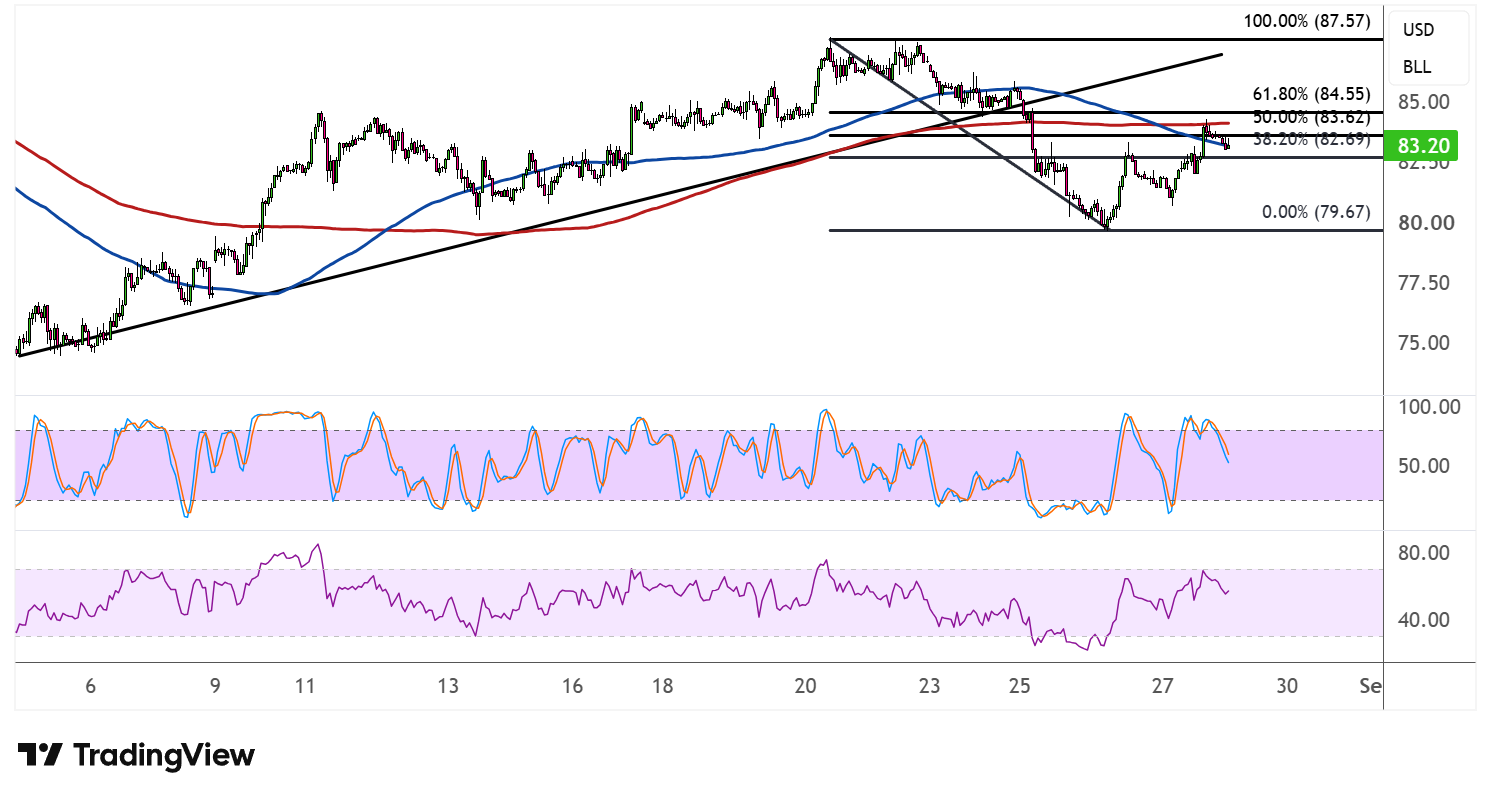
The 100 SMA is still above the 200 SMA, but the gap between the two has been narrowing, hinting that a bearish crossover could be on the horizon if the retracement fails to gain traction. Price is currently hovering near $83.20, right in the thick of this resistance cluster.
Stochastic has been climbing out of the oversold zone, suggesting buyers are attempting to regain some control in the short-term, though the oscillator could soon run into resistance if the broken trend line holds firm. RSI, meanwhile, still has room to climb before reaching overbought territory, so price could continue ticking higher while buyers hold the advantage in the immediate term.
A close back above the broken trend line and the Fib cluster could invalidate the bearish bias and open the door to a retest of the range highs. On the other hand, rejection at these levels could confirm resistance and drag WTI back down toward the bottom of its recent range.



Comments
Log in or sign up to join the conversation.