


WTI crude oil recently carved out a head and shoulders top on the daily time frame, with price breaking down through the pattern’s neckline near the $79.00 mark to confirm a shift in trend.
The selloff extended to the $74.30 area before buyers stepped in, and the commodity has since been climbing back toward the broken support in a corrective bounce.
The Fibonacci retracement tool highlights where sellers could be lurking on this pullback. The 38.2% Fib sits at $79.11, right around the former neckline, while the 50% level is at $80.59.
A deeper retracement could reach the 61.80% Fib at $82.08, which lines up closely with the descending trend line connecting the pattern’s shoulders and could be the line in the sand for a bearish continuation. If these levels hold as resistance, WTI crude oil could resume its slide toward the swing low near $74.30 or lower.
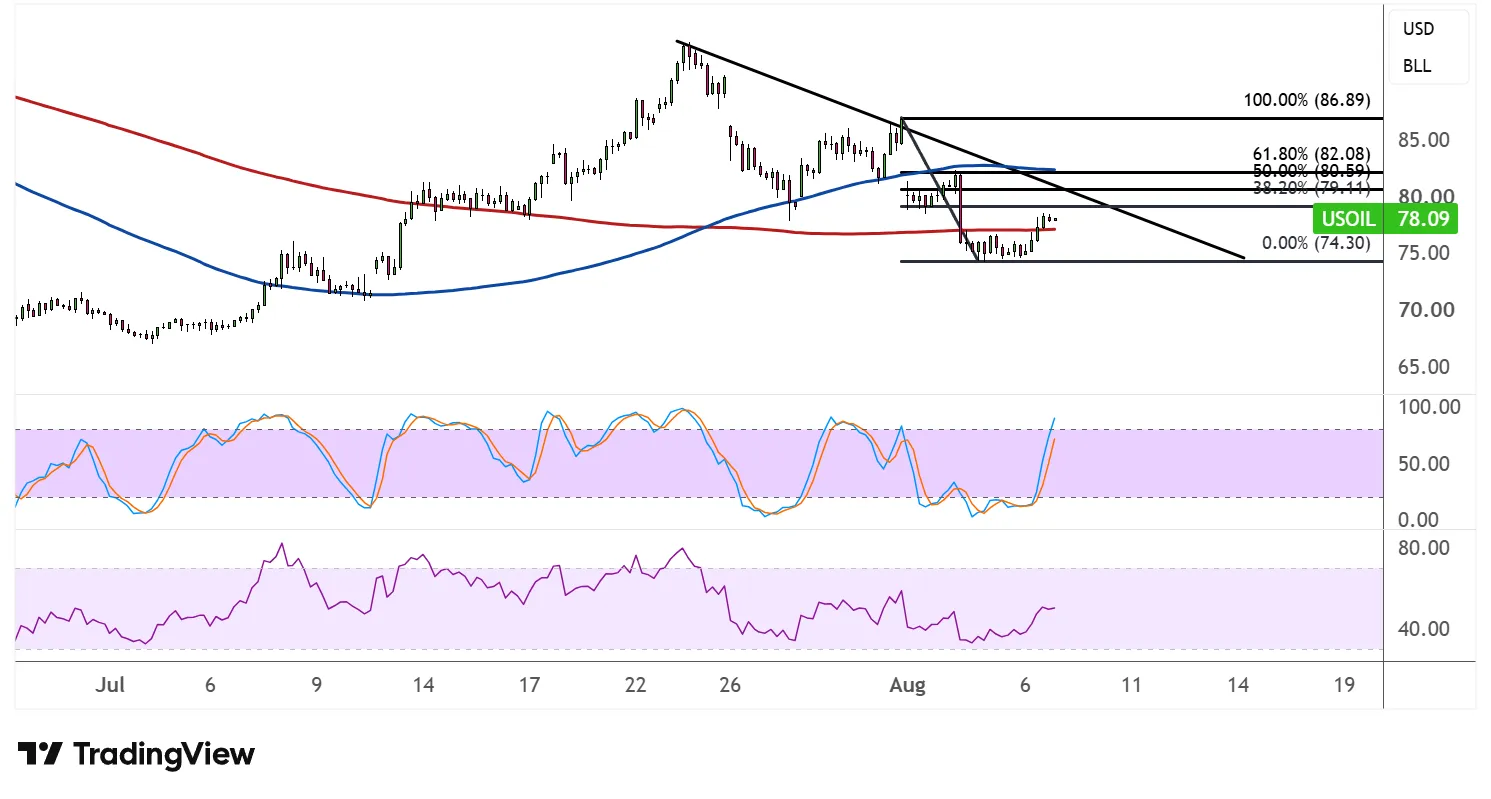
The 100 SMA has crossed above the 200 SMA, though, which could complicate the bearish case by acting as dynamic support on dips, keeping the near-term bias a bit more mixed than the chart pattern alone would suggest.
Stochastic has surged out of oversold territory and is fast approaching the overbought region, reflecting a strong return in bullish momentum that could still have a bit further to run before sellers regain the upper hand. RSI is also on the rise, climbing back toward the midline after spending some time in bearish territory, suggesting buyers have regained some short-term control even as the broader pattern points lower.
WTI crude oil could take cues from upcoming inventory data and any fresh headlines on supply disruptions, as a larger build or de-escalation in geopolitical tensions could reinforce the bearish neckline break and encourage sellers to defend the Fibonacci resistance zone.
The upcoming NFP release could also impact crude oil direction, as the outcome of the jobs report would likely influence Fed interest rate expectations and USD movements.



Comments
Log in or sign up to join the conversation.