


WTI crude oil broke down sharply from its descending trend line, tumbling from the swing high near $86.89 to test the $74.30 mark before staging a modest recovery to the current $75.78 level.
The sell-off pierced through a former support zone, which now stands to act as resistance should buyers attempt to claw back some ground. The Fibonacci retracement tool marks out where sellers could be lurking if the bounce extends higher.
The 38.2% Fib is at $79.11, which lines up closely with the lower boundary of the former support-turned-resistance zone. The 50% level sits at $80.59, near the upper edge of that same zone and close to the descending trend line, while a deeper correction could stretch to the 61.8% Fib at $82.08, which could be the line in the sand for a bearish pullback.
If any of these levels hold as a ceiling, WTI crude oil could resume its slide toward the swing low near $74.30 or lower.
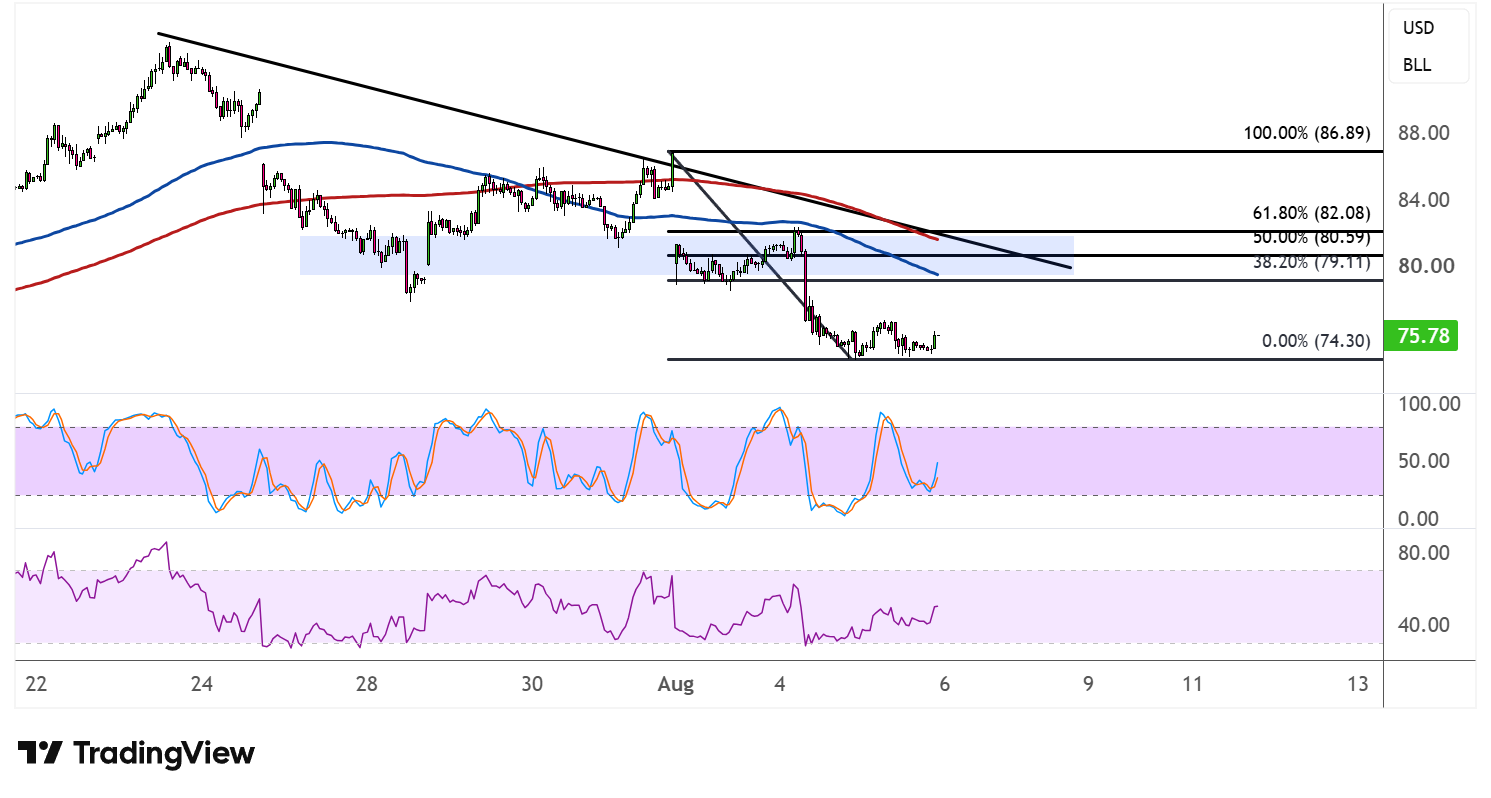
The 100 SMA remains below the 200 SMA, confirming that the path of least resistance is still to the downside, even with the recent uptick. Price is trading beneath both moving averages, so a rally into this zone could invite fresh selling interest from those looking to fade the bounce.
Stochastic is on the move up from the oversold region, reflecting a return in buying pressure over the near term. The oscillator still has room to climb before reaching overbought territory, suggesting the recovery attempt could have some legs left before running out of steam.
RSI, meanwhile, is also ticking higher but remains below the midpoint, indicating that bullish momentum is only tentative for now. Should RSI continue to climb toward the trend line and Fib confluence zone, a rejection there could reinforce the broader bearish bias, while a break above could open the door to a more meaningful trend reversal.



Comments
Log in or sign up to join the conversation.