


WTI crude oil recently broke down from its rising wedge pattern, confirming a shift in trend after the commodity had been consolidating within converging trend lines for the past couple of weeks.
Price has since fallen sharply, dropping from the wedge breakdown point near $82.00 to current levels around $75.19, with the swing low near $74.30 marking the swing low level and potential support.
However, price could still see a corrective bounce back up to the broken wedge support turned resistance, and the Fibonacci retracement tool highlights where sellers could return to push the pair lower.
The 38.2% Fib is at $79.11, close to the 100 SMA, while the 50% level sits at $80.59. A deeper pullback could reach the 61.8% Fib at $82.08, which lines up near the 200 SMA and the broken wedge support, potentially serving as the ceiling for a bearish correction.
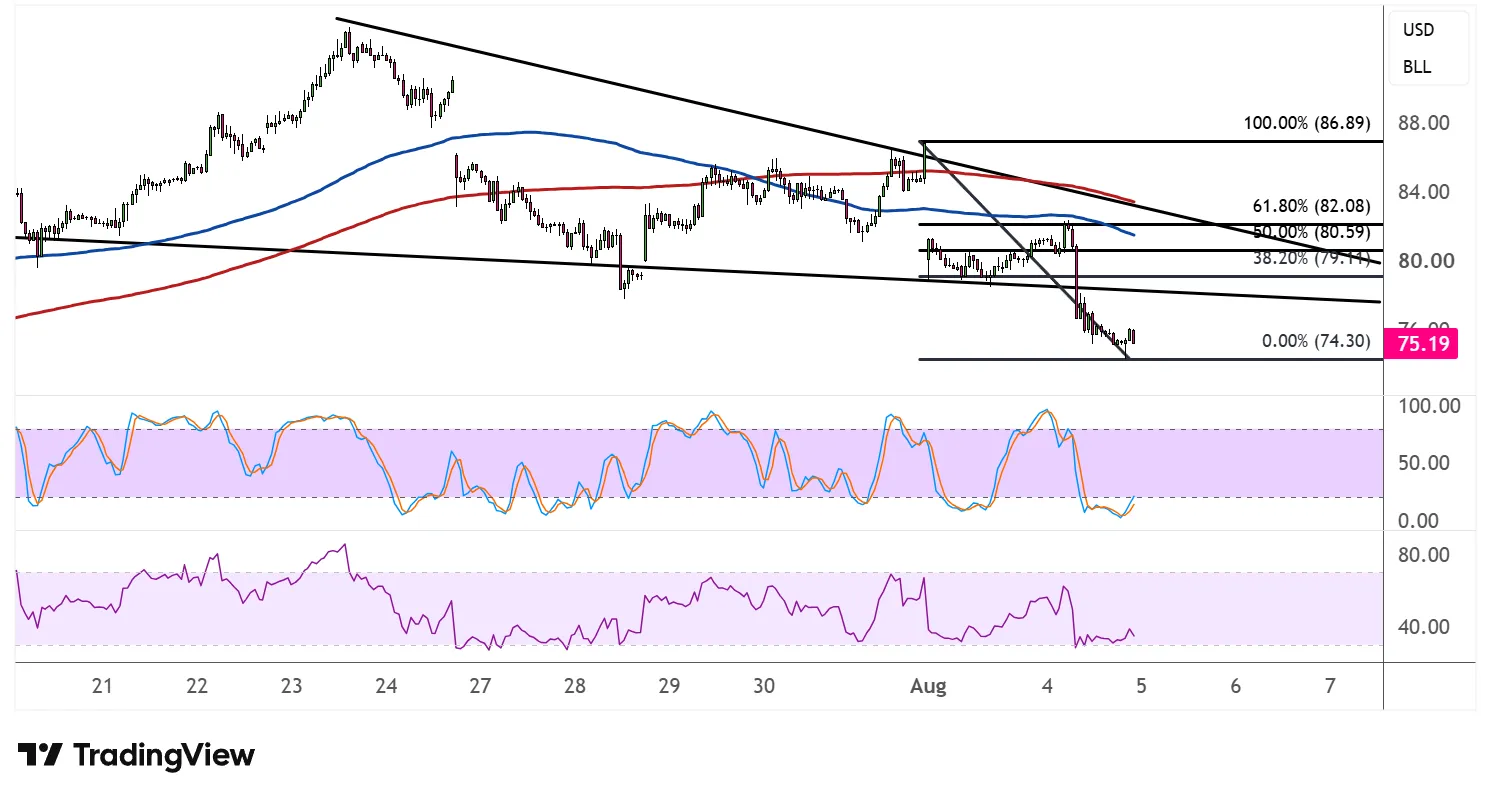
The 100 SMA is below the 200 SMA to confirm that the path of least resistance is to the downside, or that the selloff is more likely to continue than reverse. Price is also trading below both moving averages, so these could act as dynamic resistance on any recovery attempts.
Stochastic is deep in oversold territory, reflecting exhaustion among sellers, and could be due for a bounce that lines up with a pullback toward the Fib levels. RSI also has room to climb before reaching overbought conditions, so price could keep grinding higher in the near-term while buyers try to stage a comeback.
If the Fibonacci levels hold as resistance, WTI crude oil could resume its slide toward the $74.30 low or lower, possibly extending losses if the measured move of the wedge breakdown plays out in full. A break back above the wedge support, on the other hand, could negate the bearish setup and open the door for a larger recovery.



Comments
Log in or sign up to join the conversation.