


WTI crude oil is still consolidating within a longer-term symmetrical triangle on the weekly time frame, with price action compressing between a descending trend line connecting the lower highs since March and an ascending trend line connecting the higher lows since late last year.
Price recently pulled back from the triangle’s upper boundary near $90.00, which lined up closely with the 100 SMA, and is now drifting lower toward the converging support levels around $80.00.
If the triangle’s lower boundary near $75.00 to $78.00 holds, WTI could stage a bounce back up to retest the upper trend line or the 100 SMA resistance overhead. This would keep the pattern intact and possibly set the stage for a more decisive breakout later on.
However, a clean break below the rising support line could confirm a bearish resolution to the triangle, opening the door to a measured move selloff. Such a drop could carry oil back to the $65.00 to $68.00 zone, or roughly the same distance as the widest part of the formation, as sellers take firmer control of the longer-term trend.
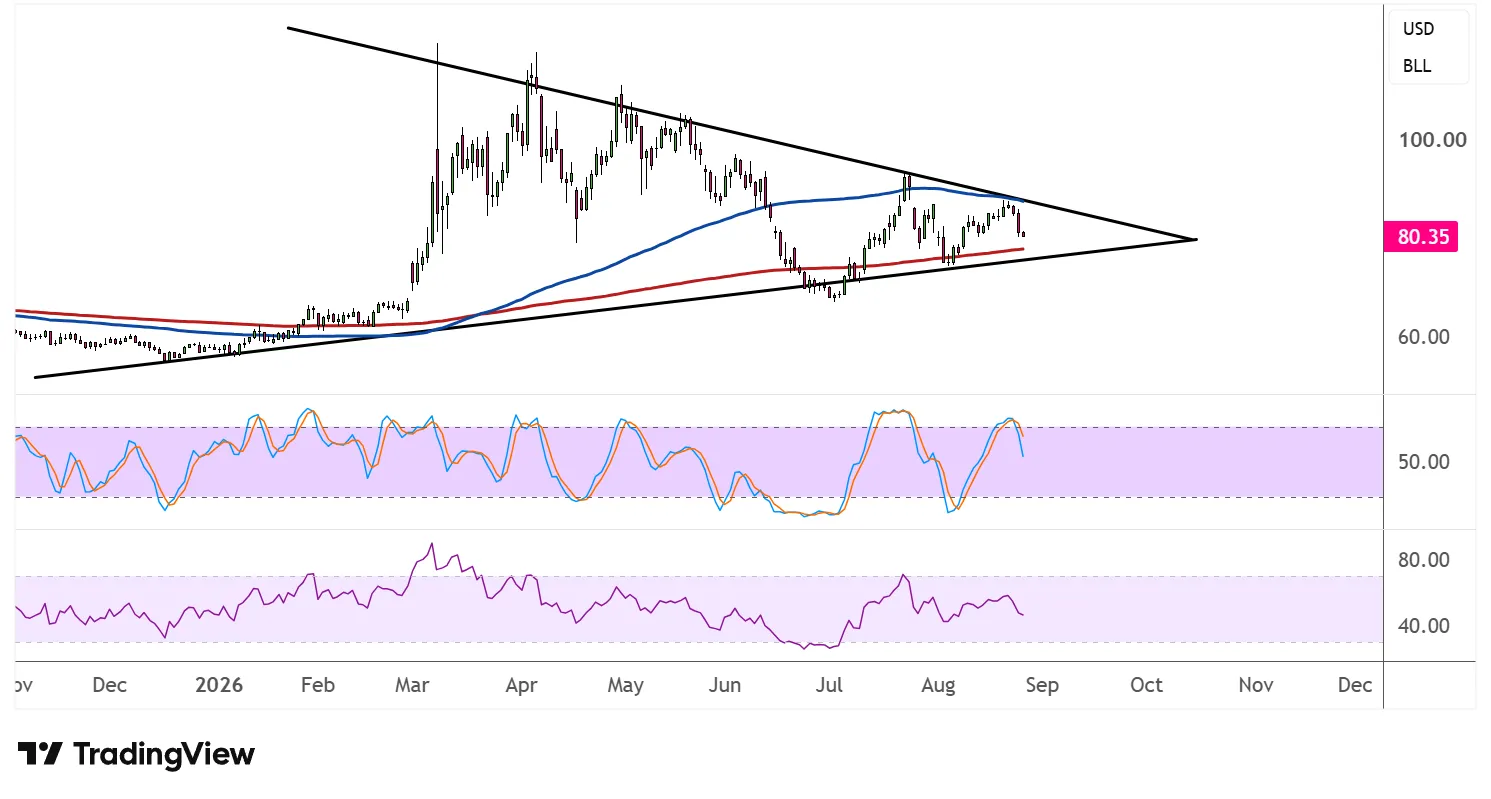
The 100 SMA is above the 200 SMA, which still points to some underlying bullish bias, but the shrinking gap between the two moving averages reflects fading momentum as the range tightens.
Stochastic has rolled over from the overbought region and is heading south, suggesting that bearish pressure could pick up from here. The oscillator has plenty of room to fall before reaching oversold territory, which means the correction could persist for a while longer.
RSI is also turning lower after failing to sustain a push above the 50.00 mark, giving sellers a bit more conviction and hinting that price could continue tracking the retreat in the oscillators.
WTI crude oil is under bearish pressure after reports of Pakistani mediators bringing a deal to Tehran sparked hopes of a US-Iran deal.



Comments
Log in or sign up to join the conversation.