


WTI crude oil is consolidating inside a symmetrical triangle pattern, with the descending trend line from the June highs converging with a rising trend line connected by higher lows since late July.
Price recently broke above its 100 SMA and is now testing the upper boundary of the formation, hovering near $84.71 per barrel.
This puts crude oil right in the vicinity of the 50% Fibonacci retracement level at $83.84, drawn from the swing high near $93.49 down to the swing low around $74.19. A break above this level could open the door to the 61.8% Fib at $86.12, which lines up closely with the triangle’s upper trend line and could be a tougher ceiling to crack.
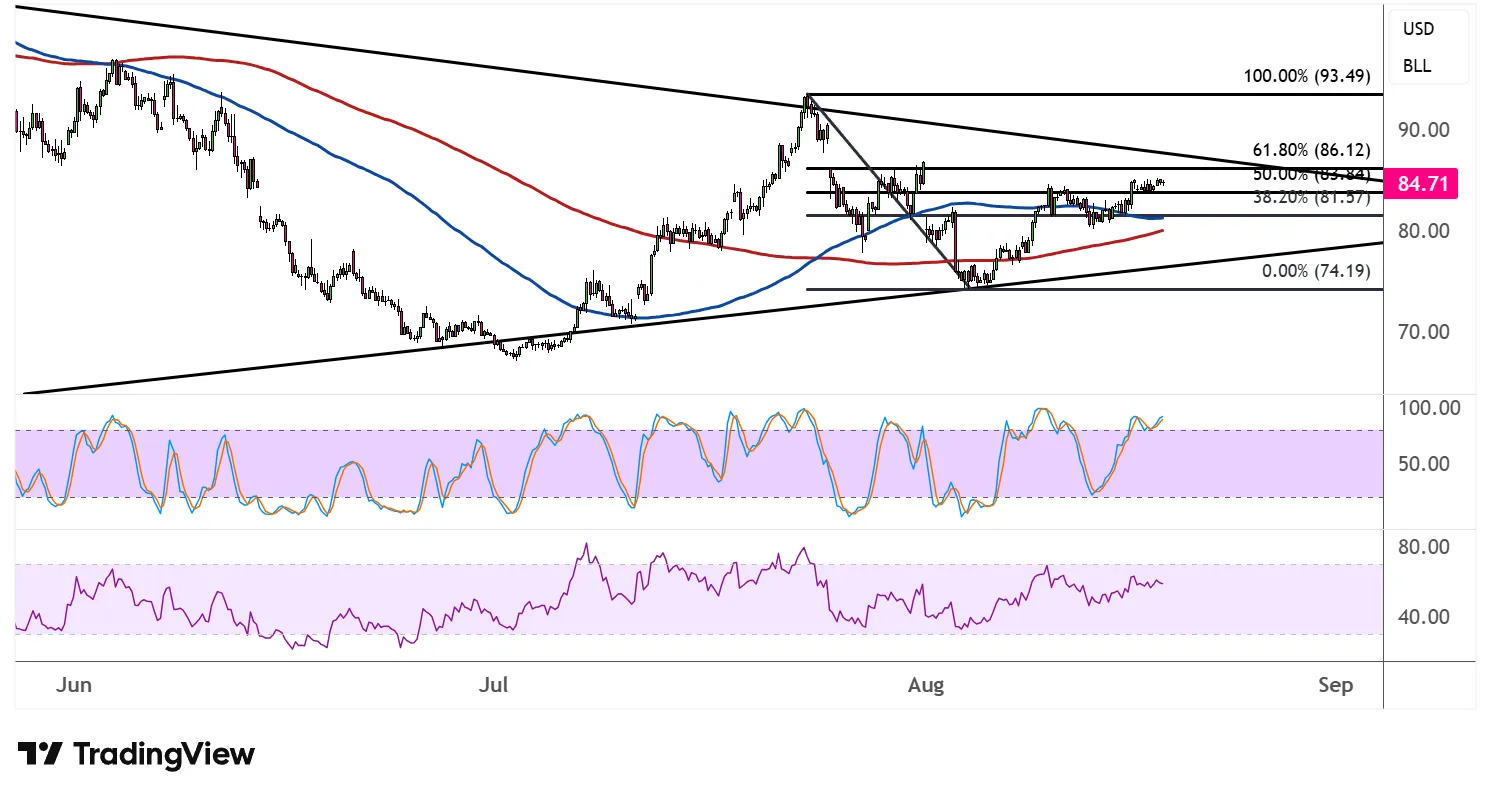
The 100 SMA has crossed above the 200 SMA, hinting that the path of least resistance could be turning higher, although the moving averages remain fairly close together, reflecting the indecision baked into the triangle pattern.
A confirmed breakout above the triangle top and the Fib cluster could pave the way for a larger climb back toward the 100% level near $93.49, while a rejection here could send price back down to retest the 38.2% Fib at $81.57 or the triangle’s rising support.
Stochastic is on the move up but has plenty of room before reaching the overbought region, suggesting that bullish momentum could still have some steam left. RSI is also climbing and is not yet in overbought territory, indicating buyers may still have the upper hand for now.
Still, since crude oil is testing a confluence of resistance from the triangle top and the Fib levels, sellers could step in around these levels to defend the ceiling, potentially triggering a pullback within the pattern before any decisive breakout takes shape.
Geopolitical tensions continue to keep crude oil supported for the time being, though the upcoming FOMC minutes release could have a stronger say on dollar direction and overall sentiment.



Comments
Log in or sign up to join the conversation.