


WTI crude oil has broken above the descending trend line that capped every rally attempt since early June, and the former ceiling is now being retested as support. Price is holding near $83.90, just above the trend line, which could be enough to keep the recovery going.
The Fibonacci extension tool, drawn off the swing low near $74.05 and swing high near $100.71, shows where the next upside targets could be found if the climb gains traction.
The 38.2% level at $84.24 is the first hurdle just overhead, followed by the 50% level at $87.38. A stronger push could carry price toward the 61.8% level at $90.53, with the 76.4% level at $94.42 as a further target should bullish momentum really pick up steam.
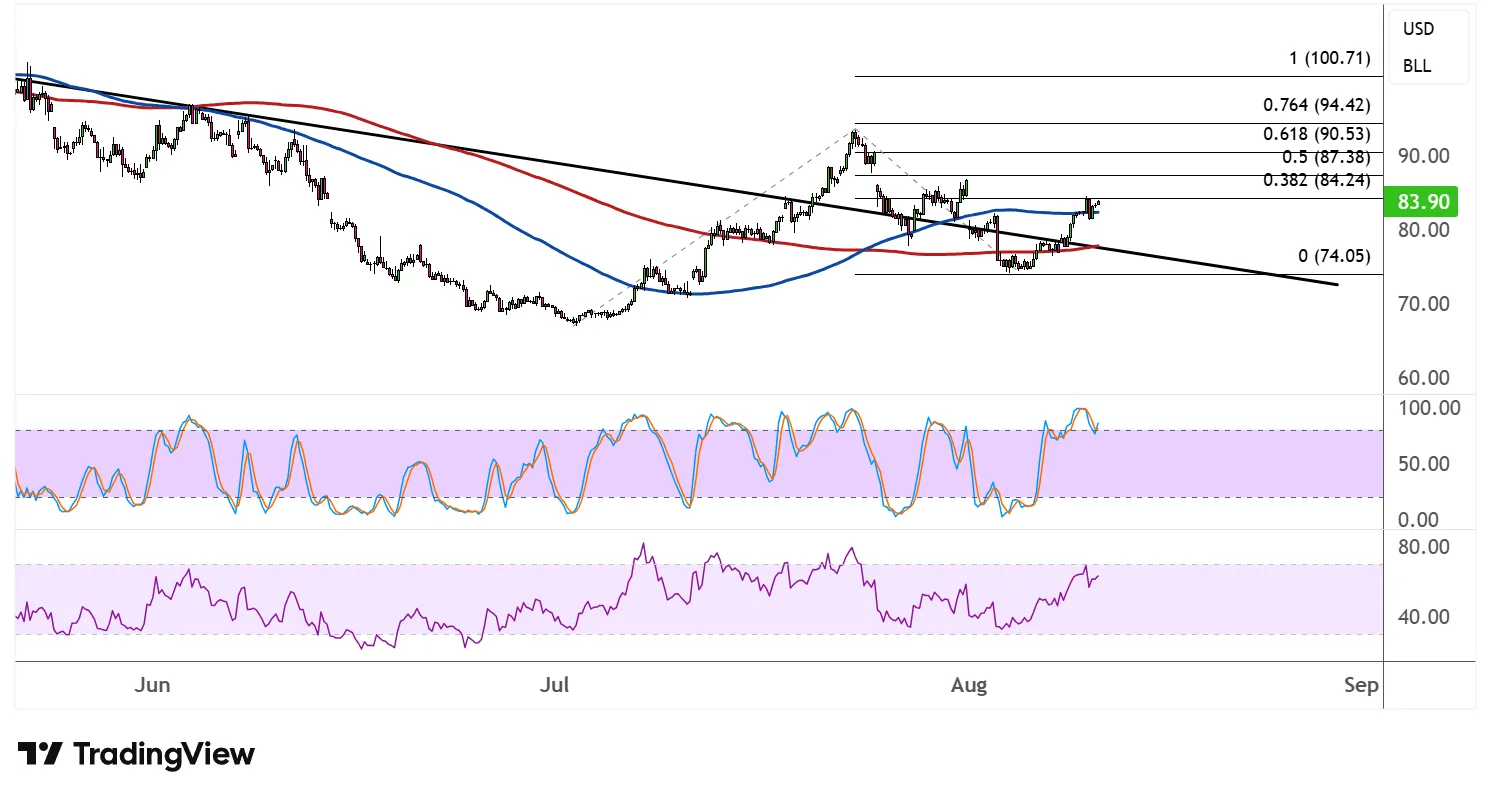
The 100 SMA has crossed above the 200 SMA, confirming that the path of least resistance has shifted to the upside after the extended downtrend earlier in the summer. Price is also trading above both moving averages, which could reinforce their role as dynamic support on any dips back toward the trend line.
Stochastic has climbed out of the oversold zone and is on the move higher, reflecting a return in bullish momentum, though the oscillator is approaching overbought territory, so some hesitation near current levels wouldn’t be surprising. RSI still has room to climb before reaching its own overbought threshold, suggesting price could continue tracking higher while buyers remain in control.
If the trend line and moving averages hold up as support on any pullback, WTI crude oil could resume its climb toward the Fibonacci extension targets outlined above. On the other hand, a decisive break back below the trend line could cast doubt on the rally and open the door to a retest of lower levels.
Crude oil’s volatile intraday run could be traced to shifting sentiment on the Hormuz standoff, as initial reports of a potential Iran-Oman deal were downplayed later on while Trump hardened his stance on economic retaliation.


Comments
Log in or sign up to join the conversation.