
Well, the bottom is falling out for stocks on Friday afternoon on the heels of a hotter-than-expected AHE print that exacerbated the ongoing bond rout.
At just in time for retail investors to get their asses completely burned after a January that saw a veritable avalanche of inflows into equity funds encouraged, in part, by Donald Trump and vacuous promises about the restoration of lost American “greatness”.
Over the last couple of days, we’ve shown you a variety of charts that seem to suggest everyone went all-in at the worst possible time. On Thursday evening for instance, we noted that TD witnessed a 50% increase in client activity in Q4…
(Click on image to enlarge)

… just as everyone is busy Googling “how to buy stocks”:
(Click on image to enlarge)

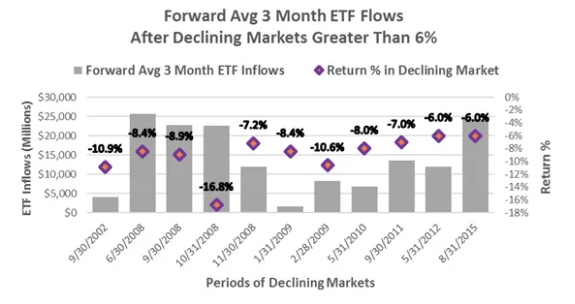
Well this seemed like a great time to show you a series of other visuals that underscore the euphoric mood that predominated right up until, well, until this week. These come from Deutsche Bank’s Binky Chadha.
Via Deutsche Bank
Aggregate shorts in cash equities and ETFs, led by cuts in Tech shorts, have for the first time fallen below the elevated range they have been in since the financial crisis.
(Click on image to enlarge)

Margin debt in brokerage accounts has risen to extremes:
(Click on image to enlarge)

While cash balances have fallen below the normal range:
(Click on image to enlarge)

Option market indicators had till last week painted a similar picture with the put/call ratio low:
(Click on image to enlarge)

Inflows into equities have surged recently to the largest monthly inflow on record:
(Click on image to enlarge)

Just one question for the folks who are behind those charts: “How’s that workin’ out for you?”
(Click on image to enlarge)


Comments
Log in or sign up to join the conversation.