

There are two more trading weeks remaining in the Q1 2019 period. The S&P 500 (SPX ) is up some 12.5% already this year and has managed to express this rally with net outflows and with outsized participation to the most defensive sectors. Seriously folks, the Utilities Select Sector Spiders (XLU) hit an all-time high last week. You have to wonder why fund managers are piling into this sector and this ETF that offers less than a 3% dividend yield.

Having said all of that about how fund managers have positioned for this rally, it goes without saying that most fund managers are once again underperforming the market. This week, S&P Dow Jones Indices released its annual report on how actively managed funds performed against their benchmarks. The conclusion is that active managers continue to show dismal performance against their passive benchmarks. For the ninth consecutive year, the majority (64.49%) of large-cap funds lagged the S&P 500 last year.

The bottom line is that the professional fund managers generally underperform the benchmark average annual return, even over time. The flight toward Index investing is only strengthening over the years, although it should also be understood that passive investing lends itself poorly to aspects of market liquidity. It’s one of the reasons the downturn in 2018 seemed endless, without volume or any natural buyers. Index/passive investing drains the liquidity pool. You don’t need any more of an example of the new market order than the downturn in 2018 or the most recent “triple witching Friday” which highlighted this point. There were only 1.3mm ES_F contracts transacted on Friday’s triple witching day. To offer a more historical context of the affects of index/passive investing strategies on the market’s liquidity, take a gander at the next chart.

S&P 500 Weekly Close & Options Pricing
The weekly close for the S&P 500 is highly relevant as it closed above its 200-DMA once again and after a 2.5% retracement in the prior week. The following charts identify just how relevant the S&P 500 weekly close is to investors.

Within the S&P 500 (top chart) weekly close of 2,822 is also the breach of the top end of the S&P 500 BOX that I have been discussing since late last year (blue lines). The S&P 500 managed to close the week above the October-December liquidity and Q1 2019 EPS revision events. In accomplishing this feat of strength that has taken just 13 weeks, it has done so with consecutive, weekly 2 sigma moves in the S&P 500.
For this past week, the S&P 500 options were pricing in a weekly expected move of roughly $41/points. By the end of the trading week, the S&P 500 had moved over $82/points before closing the week beyond the weekly expected move. In the previous week, the S&P 500 options were pricing a $33 expected move and again the index moved twice the amount. Folks, the options pricing is showing extreme inefficiency presently. But again, this also validates just how poorly positioned capital has been of late and during the market rally. Poorly positioned you say…
If we take a look at the E-minis/futures positioning through 2019, the aforementioned characterization of poorly positioned capital is also highlighted in the chart below. By and large, hedge funds have been net short the S&P 500 all year long. This also serves to facilitate the understanding that a portion of the low volume market rally has been serviced by short covering.

Furthermore and as it relates to the weekly expected move, the VIX is signaling minimal implied volatility that serves to compress the weekly expected move. The VIX fell nearly 20% last week and found a 5-month low. When we look forward to the next trading week, the S&P 500 is only expected to move $33/points.

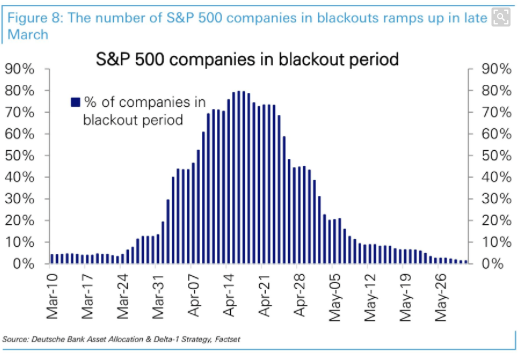
Keeping in mind that next week begins a FOMC 2-day meeting that coincides with a VIX Futures expiration cycle and it also installs a blackout period commencing for some 71.8% of corporations, a $33/point weekly expected move seems on the light side.
Fund Flows…Matter?
In a flow-less market rally we always seem to suggest the rally is lacking constitutional believability. If it were a believable rally wouldn’t it have greater fund flows and volume? That seems logical and before we offer some resolution to the question, let’s quickly take a look at the most recent understanding of fund flows and their impact, or lacking for impact, on the market.
Fund flows have been their most negative since 2008… and through the current rebound in the market.

It’s almost silly isn’t it; how can the market rally so strongly and with a Breadth Thrust and be absent positive flows? Recall from December that I reported that gamma positioning was sharply negative, market participation was lacking and algorithmic trading was driving market direction and found level-seeking. Not much has changed since that time; we have all three factors still in play shy of one major factor shifting in the gamma positioning, albeit still light positioning. So with that being contextualized; where does the fund flow relevancy come into play you might be asking yourself? It generally comes into play with the benefit of hindsight and only if found a signal post for a market trend. In short, yes, there have been completely flow-less market rallies in the past. The chart below identifies that the rallies from the 2011 low into 2013 and during 2016 also occurred with cash flowing out of equities.

The chart serves to quell some of the myths about just how relevant fund flow data is and how it correlates with market moves and/or outlooks on the market. Nonetheless, it’s still recommended to study fund flow data for future reference, just like today’s reference point. Additionally, remember that fund flows are just one study/data point in the compilation of data points that make up a market analysis and/or outlook. For those inquiring minds that want to know, yes, fund flows were positive for the past week.
It’s Fed Week
With earnings season out of the way and several weeks before the next earnings season kicks-off in earnest, this week’s focus will be on the FOMC’s 2-day meeting that culminates on Wednesday with a “no rate hike” announcement anticipated and press conference from Fed Chairman Jerome Powell. More important to investors, analysts and economists will be the Fed’s dot-plot.
The safe bet, favored by most economists, is the Fed lowers the projected path on interest rates to one hike in 2019 and one more in 2020. It would take only 3 officials to cut their outlook for interest rates to lower the Fed’s median forecast down to one hike. It would take 7 officials to move to lower it to zero.
Having one rate hike penciled in will be a communications challenge for the dovish Fed. It would contradict the message sent to markets after the January meeting. That’s why Michael Feroli, chief U.S. economist at JPMorgan Chase is of the opinion the FOMC voting members will somehow get to zero rate hikes with the dot-plot. Make no mistake about it, the dot-plot is the risk to the market rally, it will either be validated or lose it’s might if the Fed and market can’t align rate hike expectations come Wednesday.
Investors shouldn’t expect the dot-plot to be exiled just yet, not all FOMC members agree with such a measure. What is rather interesting though, as we ponder the FOMC impact on markets this coming week, is the notion of a rate cut.

According to the CME’s FedWatch Tool, the market is pricing in a 24% probability of a rate cut by December of 2019. This would likely occur with a deepening of the global economic slowdown and one that finds the U.S. economic slowdown also intensifying.
The Fed is widely expected to remain patient with rate hikes as inflation has faltered since August of 2018. With that being said, don’t be surprised if within the Fed’s statement they take down their economic outlook for the U.S. economy a tick or two also.
Last, but certainly not least will be a focus on the Fed’s balance sheet roll-off activity that has come under criticism. The Fed has indicated the possibility of ending Quantitative Tightening later in 2019, but an update on this exercise will be required of the Fed to avoid investor angst.

Undoubtedly, QT has factored negatively into the S&P 500’s performance in 2018 and it will require the Fed’s cooperation to sustain the 2019 rally.
Economic Data
As we continue to monitor and review the weekly economic data both domestically and internationally, we can’t help but to recognize that we may have experienced a trough period of economic weakness. It will undoubtedly take some time to prove out this sentiment. One of the most important measures we monitor with regards to global economic production and manufacturing is the Baltic Dry Index. The Baltic Dry Index is a shipping and trade index which measures changes in the cost of transporting various raw materials. Global factors play a key role in supply and demand of the BDI.

Previously, the BDI had dipped dramatically, just as it rose sharply in the August-September period. Here is the previous longer-term chart and what I had determined based on some one-offs.

“The Baltic Dry Index is close to its lowest level since August 2016. But as we can clearly see within the chart, much like factory orders spiked in August, so did the Baltic Dry Index. This was all front loading orders folks, all front loading. But it proves amazing that such outsized orders and rates from August are so easily forgotten and the tariff implementation that caused such orders and rates have been dismissed now with both manufacturing slowing and rates near 2016 levels. The anomalies in the orders from August will obviously take some time for end-user inventories to work through nonetheless.
With the analysis I performed back in February, I drew the conclusion that low inventories, coupled with the anomalistic order flow as a result of tariff implementations, would eventually show trough level PMIs and improving production and shipping rates. Since that time, the Baltic Dry Index has trended higher alongside an increase in orders.

To the extent that Durable Goods were previously reported with negative order flow since October 2018, the revisions offered in the most recent January report indicate 3 consecutive months of positive order flow.

Both November and December Durable Goods orders were revised higher. To the extent that Durable Goods orders are trending higher, this should serve to forecast near-term upticks in PMIs both domestically and abroad. We’re already seeing Industrial Production uptick in the Eurozone.

Industrial activity in the Eurozone saw an upturn in January, after two straight monthly declines. Industrial production bounced by 1.4% m/m in January after dropping by 0.9% in December, beating expectations of a 1.0% rebound. On an annualized basis, the factory output dipped by 1.1% in the reported month versus a 4.2% drop seen last.
For this week, economic data will be highlighted by the housing sector data, factory orders, Philly Fed Manufacturing Index and Leading Economic Indicators (LEI).
The Long Game
The remarkable equity market rally still carries with it some risks, but I urge investors to consider the long game or long-term thesis of investing in quality companies that show a propensity for earnings growth. While the rally might seem long in the tooth and not with its usual positioning or favorable correlations that validate such a significant rally, the market can be rationalized for most any statistic or historic data point one puts forth. For that reason if not any other, I refer to the previous statement of considering the long game. With that said we recognize one such market correlation that has many an investor befuddled and without comfort for adding equity exposure, at least for now.
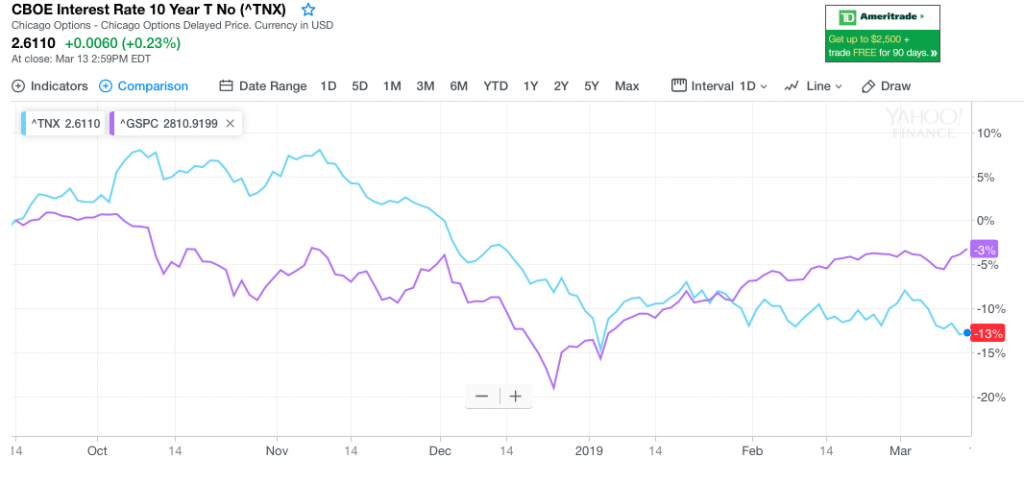
The bond market seems to be throwing cold water onto the equity market rally. And while equities rallied sharply on Friday, bond yields fell sharply… again. The reality is that during the 80s and 90s, this was actually the normal trend. Mostly due to the extreme level of rates during the 80s that had nowhere to go but lower in a consumer-driven economy. This proved a historic anomaly.
In 2014, the 10-year Treasury yield sank from 3% to 2.1% over the course of the year, and the S&P 500 gained more than 11 percent. Likewise, over the course of 2017, when yields slanted lower as stocks had one of the most constant uptrends in memory, rising 20% with no pullbacks of 5% or greater.
Back in the first half of 2016, with global yields remaining quite low and a similar mix of dividend-centric and growth stocks carrying the market higher, the S&P traded up to a forward price/earnings multiple above 17, until profit forecasts finally bottomed and growth expectations picked up. Right now, the S&P 500 trades at 16.3X forward 12-month earnings; it’s not that expensive when we look at like periods.
Even with defensive market positioning, negative YTD fund flows and earnings expected to fall in the Q1 2019 period, the market has rallied. Possibly of greatest importance, given the S&P 500 BOX breakout this past week is the market’s breadth. The determining factor going forward is of course earnings.
Market Outlook & Earnings
What the market expressed in Q4 2018 was a re-pricing of risk assets that forecast a YOY earnings decline and with a trough, 13.9 X forward 12-month PE. Risk assets tend to price in forward-looking fundamentals. With Q4 2018 earnings season mostly completed came FY19 guidance and newly forecast Q1 2019- FY19 EPS estimates from the analyst community. The forecasts are less dire than the market had priced late last year and thus the rebound is congruent with the market’s long-term correlation to earnings.

A case is building for growth to bottom around mid-year 2019, as consumers respond to labor income gains, low inflation, a rebound of equity markets, the patient Fed, and decreased political risks (conclusion of the US government shutdown and assuming a favorable trajectory for US-China trade negotiations and Brexit). Given the aforementioned, we believe investors are therefore likely to look through the soft patch and increasingly price in the H2 growth rebound, particularly if we see a resolution to the US-China trade dispute. This geopolitical/macro issue is breaching the resolution timeline forecast previously outlined by the USTR, but without escalation will likely remain a net positive for risk assets until resolution later this year.
If a trade deal materializes, it will remove uncertainty and could be a source of positive revisions since this catalyst is mostly not in consensus numbers. The Fed’s dovish pivot (and broader dovish tilt from global central banks) provides another pillar of support for equities.
Between the present and the H2 period, however, some indicators suggest the S&P 500 may be due for a pullback.
- The percentage of stocks above their 50-day moving averages is still high at 84%, though down from the recent peak of 92%.
- Put/call ratios suggest investors are complacent; more nervousness is typical ahead of rallies.
- The S&P 500 has failed to sustain levels above the 2,800 level four times since mid-October, making a breakout more difficult.
- Support for the S&P 500 below the 50-day moving average is at 2,650, 3.4% below Friday’s closing level.
As we turn our attention to the all too critical earnings outlook, we are forced to recognize that estimates have further declined for the Q1 2019 period and the FY19 period. According to FactSet, for the first quarter, analysts are now expecting S&P 500 companies to report a decline in earnings of -3.6% and growth in revenue of 4.9 percent. The updated forecast represents an additional .2% decline in earnings week-to-week.

- For Q2 2019, analysts are projecting earnings growth of 0.1% and revenue growth of 4.6%.
- For Q3 2019, analysts are projecting earnings growth of 1.8% and revenue growth of 4.4%.
- For Q4 2019, analysts are projecting earnings growth of 8.1% and revenue growth of 4.8%.
- For CY 2019, analysts are projecting earnings growth of 3.8% and revenue growth of 4.9%.
In the week ahead, 7 companies will be reporting Q1 2019 results, even though Q1 earnings don’t materially kick-off until April. Nonetheless, one big Dow Jones Industrial Average (DJIA) component is set to report on Tuesday, FedEx (FDX).

Investor Takeaways
Geopolitical risks and a global economic slowdown had pushed equity prices lower in late 2018. With FY19 corporate EPS guidance in-hand, analysts have been afforded the opportunity to forecast FY19 estimates that have been found to show YOY growth, even if not as robust as the Tax Reform induced jolt to earnings in 2018. Risks to the global economy remain, although a trough in economic output may have been established in the Q1 2019 period.
Green shoots in the economic data may begin to surface at the end-of-quarter period, which will also find fund managers in rebalancing mode. Certain economic data is already rebounding while key shipping index data are reversing late 2018’s declines. I remain constructive on the markets as a whole long-term.
While the yield curve remains flattening and some portions of the yield curve inverted presently, the potential for yields to rise near-term and with improved economic data remains elevated. In the more recent past, U.S. Treasury yields declined, driven by strength in core European government bonds following the dovish ECB policy announcement, which pushed yields to the low end of their recent range. As fundamentals improve and with a patient Fed, it’s likely that yields remain range bound near-term, but with an upward bias.
Comments
Log in or sign up to join the conversation.