
After a lackluster week for equities in the middle of the month and heading into the end of the quarter, last week equities found their footing once again and finished higher for the week once again. The S&P 500 (SPX) finished higher by 1.2% for the week and is now up some 13% year-to-date. Although this has been a significant rebound from the Q4 2018 period and the best Q1 since 1998 (yield curve inverted in 1998), the benchmark index had been range bound for the greater part of a March. Although history isn’t always a useful guide, we can use it as a means of risk management. For this purpose, if nothing else, let’s look at when the S&P 500 has been up 10% or more for the Q1 period since 1950. The following chart comes from LPL Financials Ryan Dietrick.
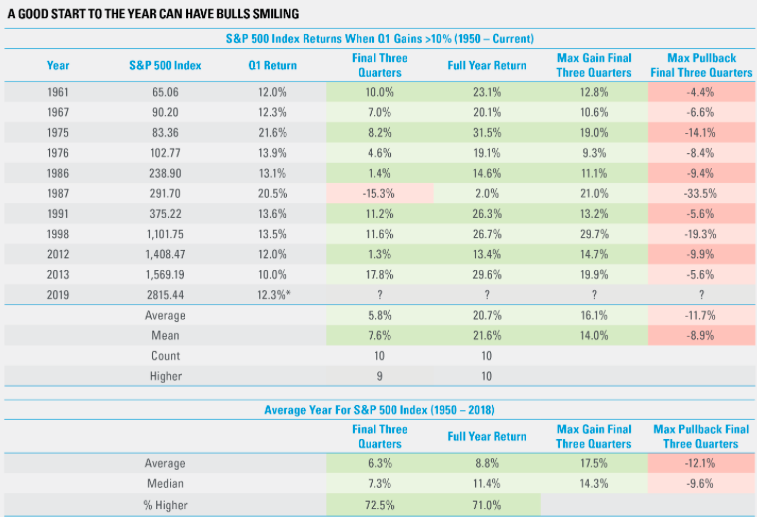
There are 2 big takeaways from the table above I want investors to focus on:
1. The median return for the year is just above 14% while 2019 has already seen a 13%+ return. This suggests the upside is limited from here.
2. Look at the last column in the table, which we’ve extrapolated and presented below.
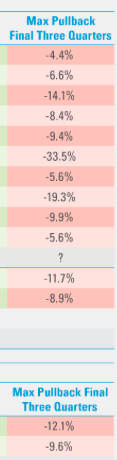
As shown in the table, there’s a median pullback of greater than 9% within the final 3 quarters of the year. History suggests markets simply do not go up in a straight line and when they’ve offered a powerful move in the Q1 period, much of the gains are retraced before moving even higher in the calendar year.
My big picture view and forecast for the market in 2019 remains intact, centering on the following acronym explanation. EFG will likely find (E) earnings trending higher beyond Q1, Federal Open Market Committee (F) will likely not raise rates in 2019 as well as end its balance sheet run-off in September and the global economy (G) will likely trough in H1 before trending higher in H2. With this, I anticipate global equity positioning to also shift from a period of equity outflows to a period of inflows that extends into Q1 2020. With that said, we turn our attention to the S&P 500/VIX broader picture within the chart below.
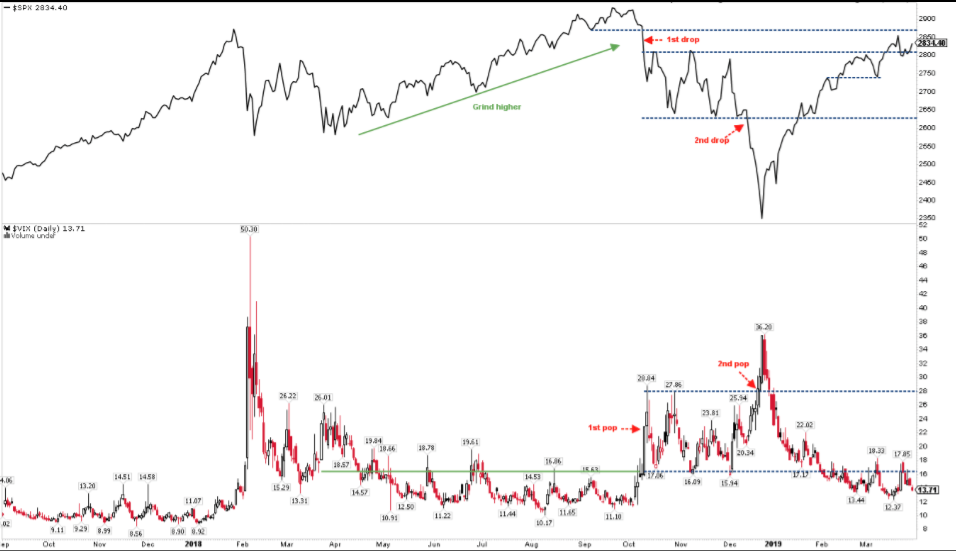
While we can’t deny that most aspects of the Q1 market rally are unattractive, certain aspects are found with favor, as I’ve discussed daily in our live Trading Room at finomgroup.com (for whom I am employed, subscription necessary). More importantly, the chart above is most relevant as it depicts the present resting place for the S&P 500, which is above the S&P 500 BOX (2,640-2,800). Significant Breadth Thrust and Zweig Thrust have culminated in a rather strong market rally despite equity ETF outflows year-to-date. With a focus on the S&P 500, we are seeing what is likely resulting in a range bound period for the index and prior to its next determined direction, breadth divergence.
To reiterate, markets don’t go up in a straight line and as such profit taking comes into play. Nonetheless, at the end of the quarter, most indices and index ETFs have worked off their overbought conditions from the beginning of March.
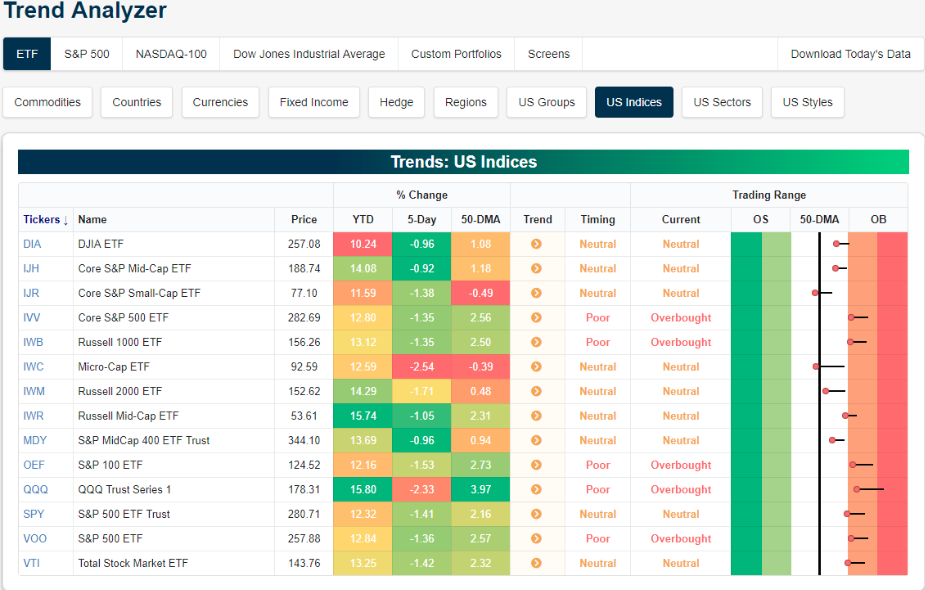
Only five ETFs are overbought while the remaining nine are neutral. Every ETF has seen a bit of mean reversion in the past week as seen through the long tails in the trading range section. Whereas many were firmly or—in the case of the Nasdaq (QQQ)—extremely overbought not long ago, about half are now teetering between overbought and neutral. Others are more firmly neutral with the Core S&P Small Cap (IJR) and Micro Cap (IWC) actually both moving below their respective 50-DMAs. Additionally, not a single ETF has managed to work its way into the green this past week as almost every index ETF has declined 1% or more as the hit from last Friday still lingers.
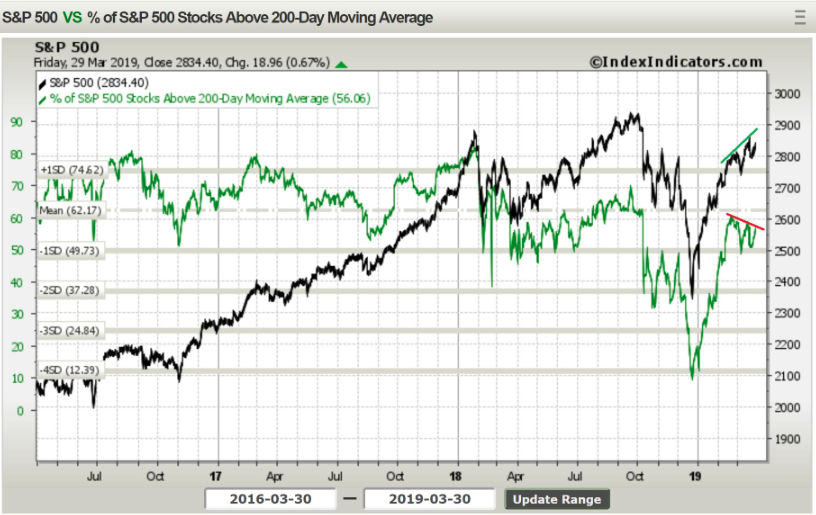
The breadth divergence noted above, combined with most ETFs seeing some mean reversion, is the market normalizing after a significant Breadth Thrust. Nothing is terribly overbought or expressing FOMO in the market place. Even RSI on the benchmark (SPY) ETF isn’t reading overheated levels.
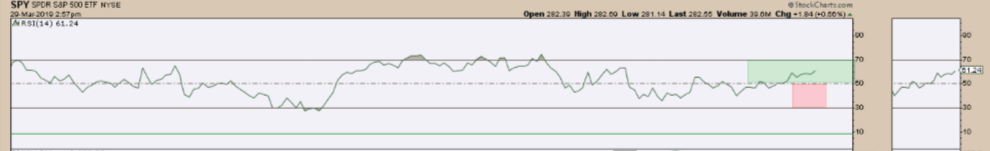
It would be terribly difficult to claim an overheated or exhausted market at this point and with the RSI in the mid-upper 50s.
In completing the Q1 2019 period, the weekly expected move found options pricing more reliable as the S&P 500 managed to stay within the weekly expected move. Last week’s expected move was some $52/points, but the index closed within the range, starting the week right around 2,800 and finishing the week at 2,834. For the coming week…
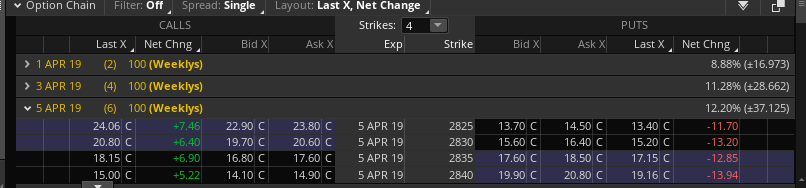
As depicted in the table above, this coming week’s expected move is roughly $37/points. The decline in the weekly expected move is in keeping with the WoW decline in implied volatility/VIX.
Fund Flows
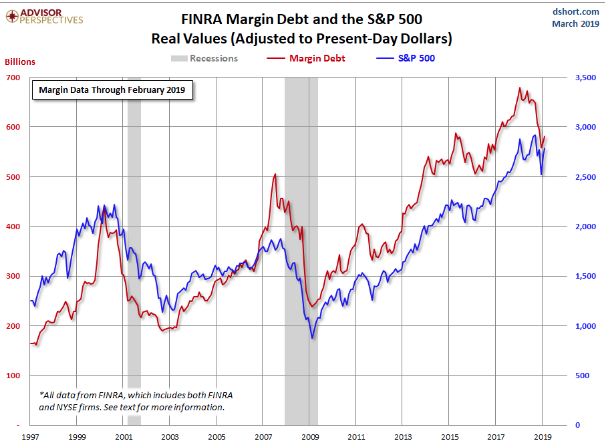
Although equity fund flows have been consistently negative throughout 2018 and into 2019, there has been an uptick in margin debt. The following chart is simply the yearly change of margin debt. (Yardeni Research)
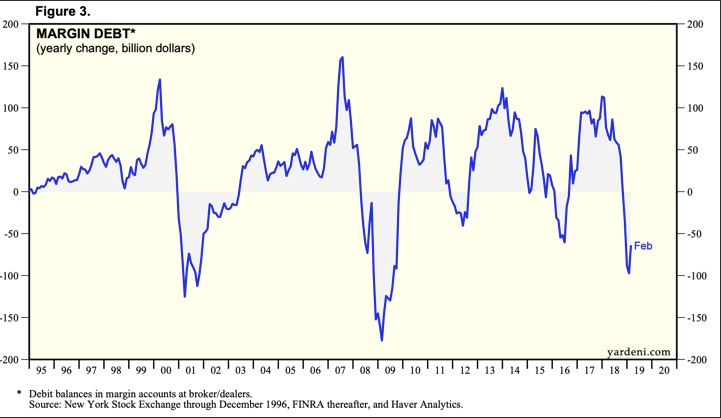
The main reason this chart is positioned ahead of going into the subject matter of fund flows is to validate the aforementioned FOMO lacking in the market comment. It’s not present in margin debt or pretty much any market indicator, including investor sentiment. With regards to how relevant margin debt is as an indicator of market direction or sentiment, you’ll likely only know in hindsight as the data is delayed a month or so. Moreover, margin debt like bond yields only go in one direction over time. In the case of margin debt, it only goes higher over time. The following chart is a better example of a notional value of margin debt over time.
Another aspect of the market’s rally that has been found without inflows, but that we favor is the all-mighty increase in money supply. An increase in money supply generally breeds greater liquidity, which couples favorably with risk duration assets.
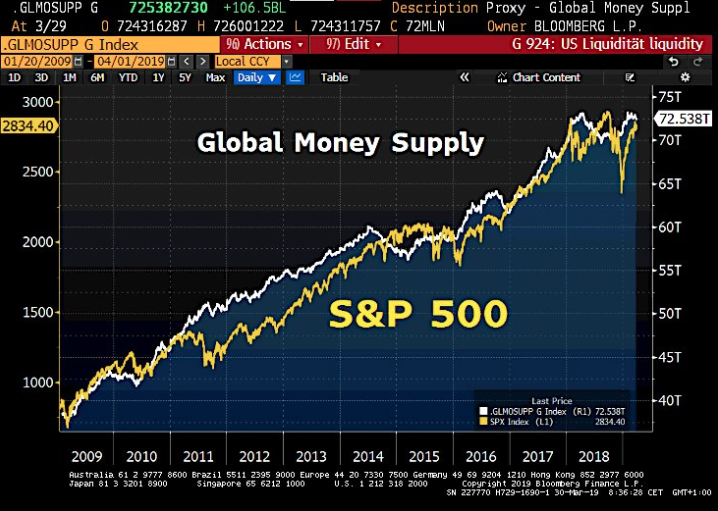
With money supply increasing since the Q4 2018 period and through Q1 2019’s market rally, CTA and vol-strategy target positioning has remained light. The Fed’s “about face” on rate hikes and dovish tilt has found the greatest constitution of fund managers piling into bonds.
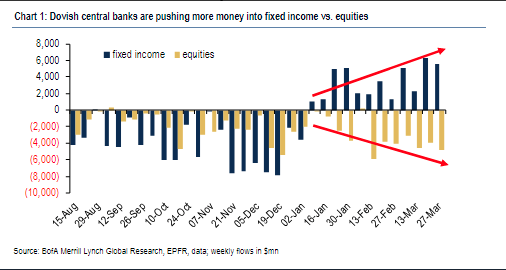
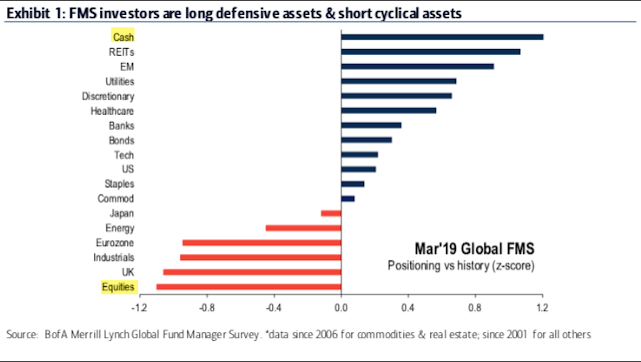
Fund managers' allocation to equities sank to their lowest level in 2-1/2 years in March. Most fund manager equity exposures are concentrated on defensives, like utilities and REITs. Their cash allocations are abnormally high.
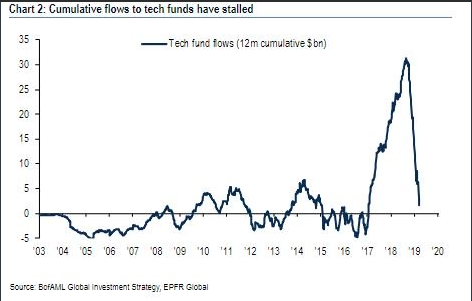
Fund managers have also been selling tech fist over hand, you know what I mean LOL! It’s quite the reversal in tech fund flows noted by BaML research. Remember the inflows from 2017-18; those inflows are all but completely gone.
Whatever the reason may be, valid or invalid, bonds continue to find favor over equities. If that should shift, if growth expectations are found rising, new equity index highs could be in store folks. Momentum begets momentum. The main market concerns center on global growth slowing, providing headwinds for corporate earnings. All it will take is a minor improvement in economic conditions to spur a greater rebound in the earnings picture come H2. And without any further delay, here are the latest weekly fund flow statistics from Lipper/Reuters:
- The ETF universe suffered net outflows of $4.6 billion for the week.
- Equity ETFs (-$6.3 billion) were responsible for all of the net outflows, while taxable bond ETFs (+$1.4 billion) and muni debt ETFs (+$291 million) were in net positive territory.
- On the equity ETF side of the ledger, the net outflows were dominated by SPDR S&P 500 ETF (SPY, -$3.0 billion) and Invesco QQQ Trust (QQQ, -$1.4 billion), while iShares Core MSCI EAFE (IEFA, +$1.0 billion) had the largest net inflows.
- For fixed-income ETFs, iShares iBoxx $Investment Grade Corporate Bond ETF (LQD, +$858 million) had the largest net positive flow for taxable bonds, while iShares National Municipal Bond ETF (MUB, +$178 million) led the muni debt group.
- Money market funds (+$31.6 billion) took in net new money for the first week in three and had the largest net inflows among the asset groups. The Institutional U.S. Treasury Money Market Funds (+$19.8 billion) and Institutional U.S. Government Money Market Funds (+$13.8 billion) peer groups were responsible for the lion’s share of the week’s net inflows.
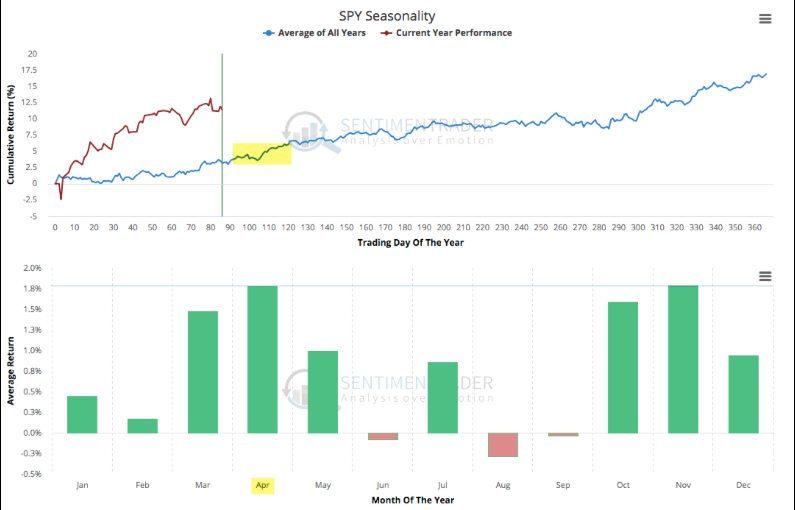
Do these variables combine to elicit a sharp pullback in the S&P 500? Of course, anything is possible, but historically April tends to be a strong month for the market. In fact, over the past 30 years, April has been the strongest month of the year.
Economic Data
In the U.S., the economic data continues to prove a mixed bag, but with improving conditions in certain sectors of the economy that may provide support for our H2 and FY19 forecast for economic growth. Last week, mortgage rates dropped to a 14-month low of just 4.06%, according to Freddie Mac. Naturally, this sent mortgage applications soaring.
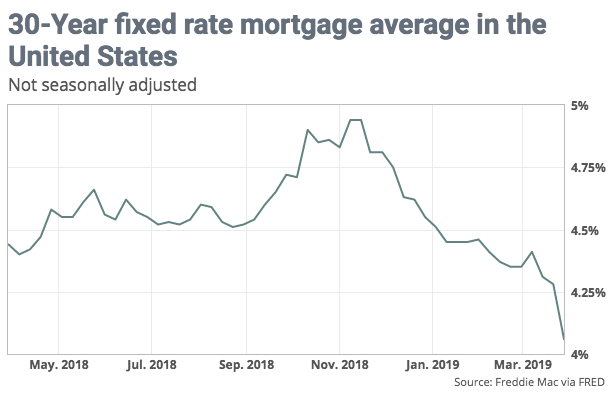
Mortgage applications jumped 8.9% last week from the previous week and 5.7% from a year earlier, according to the Mortgage Bankers Association’s seasonally adjusted report.
Both refinance and purchase applications surged, but the more rate-sensitive refis were the real leader. Those applications jumped 12% for the week and were 8.5% higher than a year ago. For much of last year, the refinance market was minimal, down dramatically from 2017, as rates rose.
With rates coming down rather rapidly, new home sales have spiked. New-home sales ran at a seasonally adjusted annual 667,000 pace in February, the Commerce Department said Friday. That was 4.9% higher than January’s rate, but just 0.6% above year-ago levels.
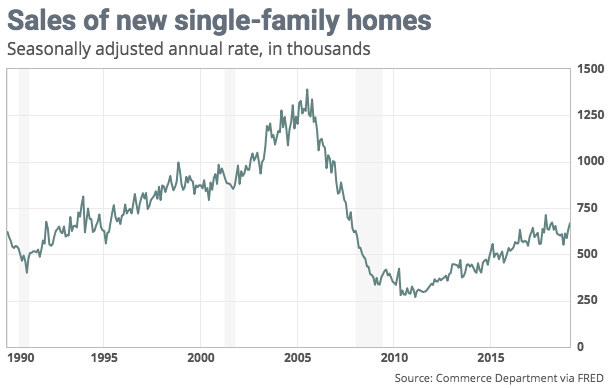
For a longer-term perspective on New Home sales (chart below), the latest report identifies that sales rose to their third highest level in 11 years in February, and have risen 11% in the past 6 months. Funny what a major dip in December 2018 produces shortly thereafter.
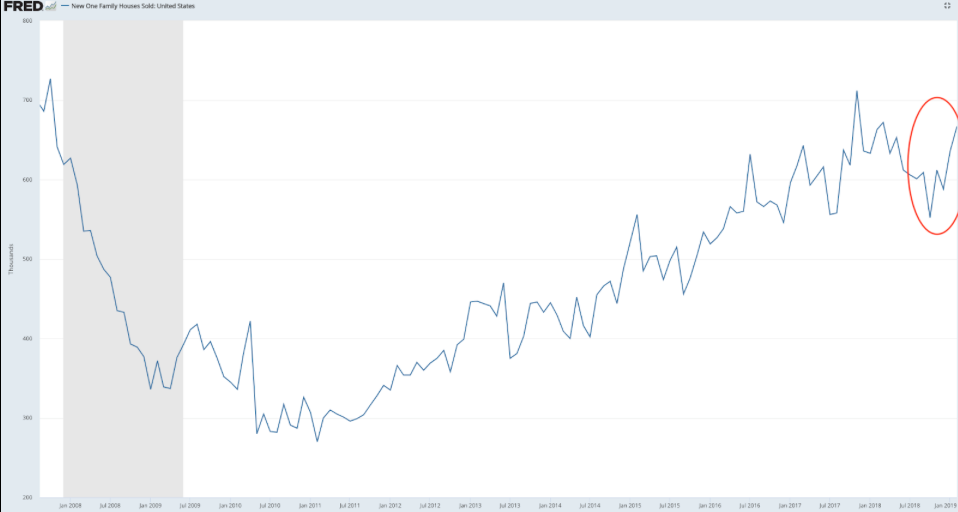
Back in mid-2018, I outlined that the slowdown in the housing sector was not abnormal and in keeping with the usual period of price appreciation that finds demand plateauing and declining, before eventually rebounding. The gyrations in the government chart of New Home sales above is a perfect reflection of price normalization that is eventually met with normalization of demand growth. But even with New Home sales trending higher over the last several months, only Existing home sales have proven to uptick. Pending home sales and housing starts continue to underwhelm and point to an uneven recovery in the housing sector. Having said that, most economists and reporting homebuilders have outlined a forecast for spring resurgence in the housing sector.
“Although the decline in net orders during the 2018 fourth quarter impacted our first-quarter housing revenues, we are encouraged by improving market conditions, which we believe should enable us to generate stronger revenues in the 2019 second half.” (KB Homes CEO Jeffrey Mezger)
In a consumer-driven economy, the most recently offered consumer spending data leaves something to be desired. Consumer spending started off on a weak note in January and inflation continued to wane. Keep in mind, this is January’s data, not February’s, which would be available had it not been for the government shutdown.
Consumer spending increased just 0.1% in January after a surprising 0.6% plunge in December. The partial government shutdown that lasted through most of January helped depress spending, as did declining prices at the gas pump. Americans also spent less on new cars and trucks during the period.
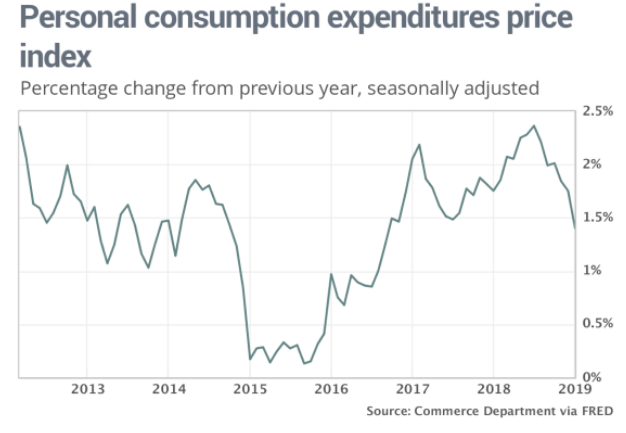
With the Fed pausing rate hikes for 2019, the latest PCE data supports the Fed’s decision as inflation continues to prove nonexistent. The PCE inflation gauge fell for the first time in almost two years. The index slipped 0.1% in January to knock the yearly rate down to 1.4% from 1.8 percent. That’s the lowest level since the fall of 2016, putting it well below the Federal Reserve’s 2% target.
While deflation is normal in the U.S. economy long-term, should incomes rise, that would prove a boon for consumers. Personal incomes increased at a steady 0.2% clip in February, the government said Friday. The report excluded figures on consumer spending and inflation in February because of delays in collecting the data. We should see the government catch up with releasing February and March data in the month ahead.
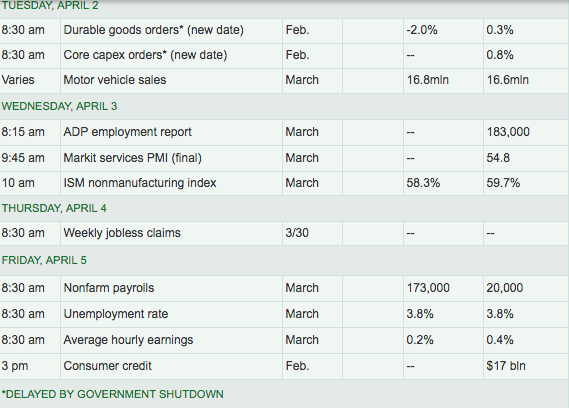
In the week ahead, there are major economic data points to consider and to either provide further upside for the equity market or put a lid on the YTD rally, even if temporarily. Shortly after responding to China’s PMI data, U.S. investors will be confronted with monthly retail sales and ISM manufacturing data on Monday. Economists are expecting modest improvements in both sets of data.
Beyond Monday, the most highly anticipated economic data for the week will come on Friday by way of the Nonfarm Payroll and wage inflation report. Investors will be mindful for any revisions to the previous monthly report, which found only 20,000 jobs had been created in the month of February. (Table from MarketWatch)
Earnings Outlook
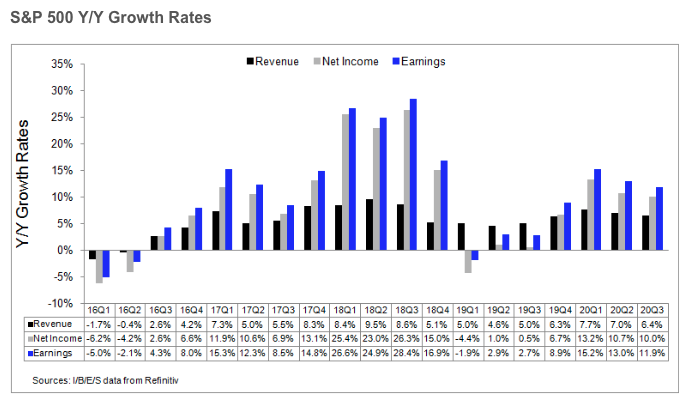
The earnings picture continues to present an expected decline in YOY, S&P 500 EPS for the Q1 2019 period. This coming week, only 3 companies within the S&P 500 will be reporting results. FactSet has revised their outlook for Q1 earnings down once again. For Q1 2019, the estimated earnings decline for the S&P 500 is -3.9%, down from 2.8% in the previous week. The forward 12-month P/E ratio for the S&P 500 is 16.3. This P/E ratio is below the 5-year average (16.4) but above the 10-year average (14.7).
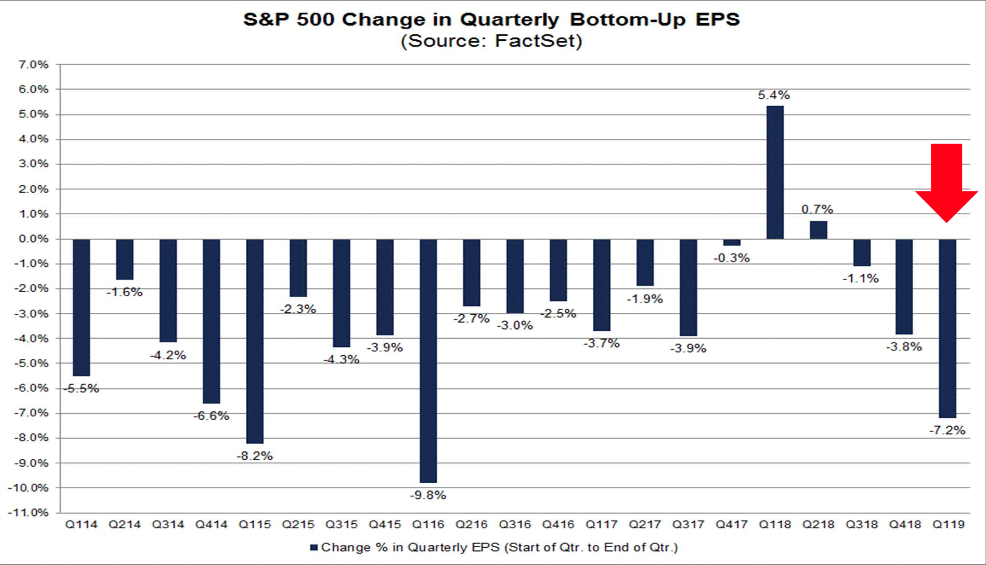
According to FactSet, the Q1 bottom-up EPS estimate (which is an aggregation of the median EPS estimates of all the companies in the index) dropped by 7.2% (to $37.33 from $40.21) during this period. As we can see from the chart above, the revisions are not nearly as bad as they were in 2016. For the remainder of the calendar year, here is the forecast from FactSet noted below:
- For Q2 2019, analysts are projecting earnings growth of 0.1% and revenue growth of 4.5%.
- For Q3 2019, analysts are projecting earnings growth of 1.7% and revenue growth of 4.3%.
- For Q4 2019, analysts are projecting earnings growth of 8.3% and revenue growth of 4.8%.
- For CY 2019, analysts are projecting earnings growth of 3.7% and revenue growth of 4.9%.
While FactSet continues to calculate and revise its Q1 metrics as S&P 500 corporate results slowly trickle in ahead of the true start of earnings season in late April, Reuters also offers its forecast for the reporting period. (See chart below)
In congruence with FactSet, Reuters has also revised its EPS forecast from a decline of -1.7% to a decline of -1.9% for the Q1 2019 period. Be it FactSet or Reuters, the main culprit behind much of the continued downward revisions have been the rising/appreciation in the U.S. Dollar.
Investor Takeaways
As the calendar turns its back on Q1 2019 and investors look forward to what Q2 2019 has in store, the first week of the month offers much to consider. Manufacturing data will be front of mind with global investors, as a rebound from the weakness in the global economy from the Q1 period is hoped to have been completed with a trough in earnings and revenues. With most central banks reversing their rate policies to favor pausing of interest rate hikes, investors have been able to remove the fear of Fed interference and inflation concerns. An accommodative central bank has long been viewed as a friend to risk assets and the enemy of volatility.
With light positioning in the market by institutional investors and fund managers, liquidity remains a concern in the event that a market pullback presents itself, which only serves as a self-fulfilling aspect of light market participation. Should economic activity trend more favorably in H2, light positioning could swiftly find CTA’s repositioning, inducing a melt-up in the market.
Comments
Log in or sign up to join the conversation.